

Genetic defects in human pericentrin are associated with severe insulin resistance and diabetes
- PMID: 21270239
- PMCID: PMC3046854
- DOI: 10.2337/db10-1334
Genetic defects in human pericentrin are associated with severe insulin resistance and diabetes
Abstract
Objective: Genetic defects in human pericentrin (PCNT), encoding the centrosomal protein pericentrin, cause a form of osteodysplastic primordial dwarfism that is sometimes reported to be associated with diabetes. We thus set out to determine the prevalence of diabetes and insulin resistance among patients with PCNT defects and examined the effects of pericentrin depletion on insulin action using 3T3-L1 adipocytes as a model system.
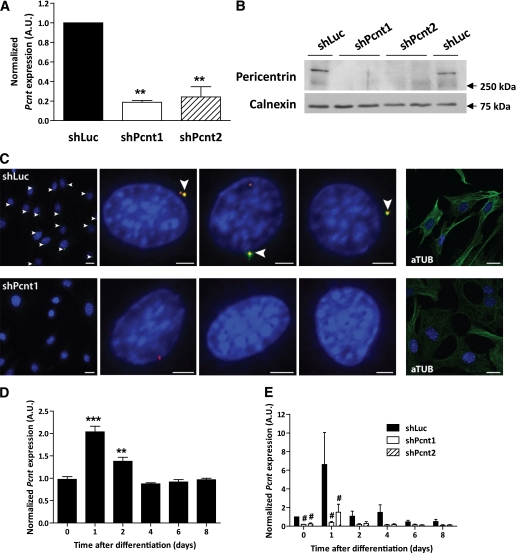
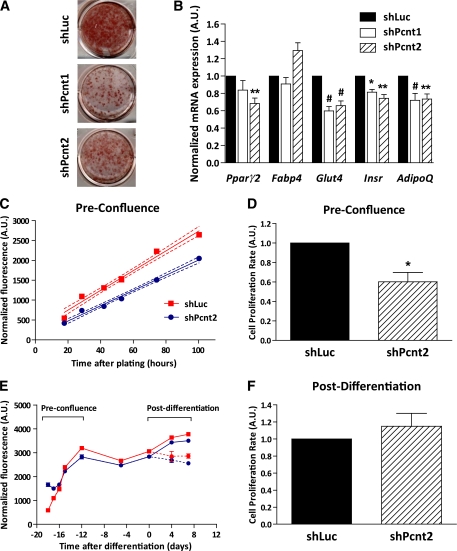
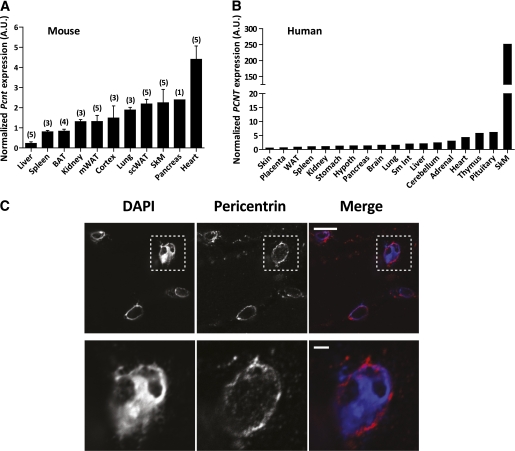
Research design and methods: A cross-sectional metabolic assessment of 21 patients with PCNT mutations was undertaken. Pericentrin expression in human tissues was profiled using quantitative real-time PCR. The effect of pericentrin knockdown on insulin action and adipogenesis in 3T3-L1 adipocytes was determined using Oil red O staining, gene-expression analysis, immunoblotting, and glucose uptake assays. Pericentrin expression and localization also was determined in skeletal muscle.
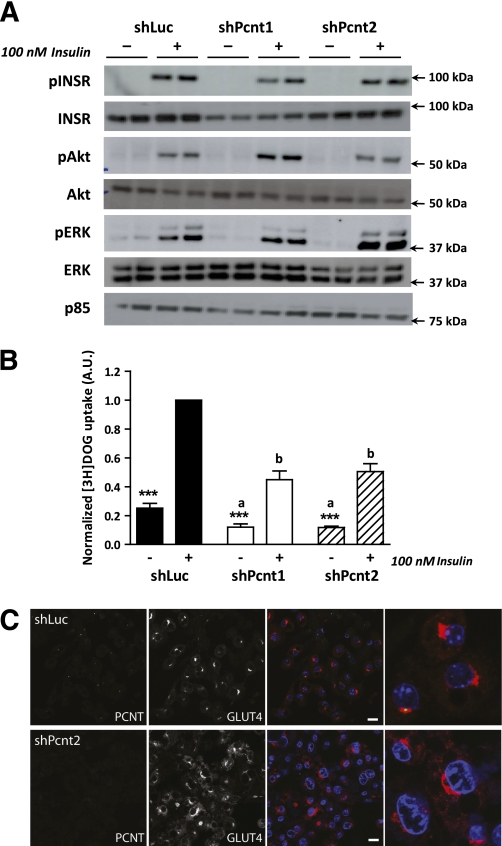
Results: Of 21 patients with genetic defects in PCNT, 18 had insulin resistance, which was severe in the majority of subjects. Ten subjects had confirmed diabetes (mean age of onset 15 years [range 5-28]), and 13 had metabolic dyslipidemia. All patients without insulin resistance were younger than 4 years old. Knockdown of pericentrin in adipocytes had no effect on proximal insulin signaling but produced a twofold impairment in insulin-stimulated glucose uptake, approximately commensurate with an associated defect in cell proliferation and adipogenesis. Pericentrin was highly expressed in human skeletal muscle, where it showed a perinuclear distribution.
Conclusions: Severe insulin resistance and premature diabetes are common features of PCNT deficiency but are not congenital. Partial failure of adipocyte differentiation may contribute to this, but pericentrin deficiency does not impair proximal insulin action in adipocytes.
Figures
Similar articles
-
Knockdown of the Alström syndrome-associated gene Alms1 in 3T3-L1 preadipocytes impairs adipogenesis but has no effect on cell-autonomous insulin action.Int J Obes (Lond). 2010 Oct;34(10):1554-8. doi: 10.1038/ijo.2010.92. Epub 2010 Jun 1. Int J Obes (Lond). 2010. PMID: 20514046
-
A novel role for the centrosomal protein, pericentrin, in regulation of insulin secretory vesicle docking in mouse pancreatic beta-cells.PLoS One. 2010 Jul 27;5(7):e11812. doi: 10.1371/journal.pone.0011812. PLoS One. 2010. PMID: 20676397 Free PMC article.
-
Pericentrin Is Related to Abnormal β-Cell Insulin Secretion through F-Actin Regulation in Mice.PLoS One. 2015 Jun 17;10(6):e0130458. doi: 10.1371/journal.pone.0130458. eCollection 2015. PLoS One. 2015. PMID: 26083368 Free PMC article.
-
Requirement of Cavin-2 for the expression and stability of IRβ in adequate adipocyte differentiation.Mol Metab. 2022 Jan;55:101416. doi: 10.1016/j.molmet.2021.101416. Epub 2021 Dec 9. Mol Metab. 2022. PMID: 34896640 Free PMC article.
-
Metabolism and insulin signaling in common metabolic disorders and inherited insulin resistance.Dan Med J. 2014 Jul;61(7):B4890. Dan Med J. 2014. PMID: 25123125 Review.
Cited by
-
The centriolar satellite proteins Cep72 and Cep290 interact and are required for recruitment of BBS proteins to the cilium.Mol Biol Cell. 2012 Sep;23(17):3322-35. doi: 10.1091/mbc.E12-02-0134. Epub 2012 Jul 5. Mol Biol Cell. 2012. PMID: 22767577 Free PMC article.
-
Clinical and functional characterization of a patient carrying a compound heterozygous pericentrin mutation and a heterozygous IGF1 receptor mutation.PLoS One. 2012;7(5):e38220. doi: 10.1371/journal.pone.0038220. Epub 2012 May 31. PLoS One. 2012. PMID: 22693602 Free PMC article.
-
Gene Networks of Hyperglycemia, Diabetic Complications, and Human Proteins Targeted by SARS-CoV-2: What Is the Molecular Basis for Comorbidity?Int J Mol Sci. 2022 Jun 29;23(13):7247. doi: 10.3390/ijms23137247. Int J Mol Sci. 2022. PMID: 35806251 Free PMC article.
-
Drosophila PLP assembles pericentriolar clouds that promote centriole stability, cohesion and MT nucleation.PLoS Genet. 2018 Feb 9;14(2):e1007198. doi: 10.1371/journal.pgen.1007198. eCollection 2018 Feb. PLoS Genet. 2018. PMID: 29425198 Free PMC article.
-
Rediscovering Primary Cilia in Pancreatic Islets.Diabetes Metab J. 2023 Jul;47(4):454-469. doi: 10.4093/dmj.2022.0442. Epub 2023 Apr 28. Diabetes Metab J. 2023. PMID: 37105527 Free PMC article. Review.
References
-
- Reaven GM. Pathophysiology of insulin resistance in human disease. Physiol Rev 1995;75:473–486 - PubMed
-
- Lee JM, Okumura MJ, Davis MM, Herman WH, Gurney JG. Prevalence and determinants of insulin resistance among U.S. adolescents: a population-based study. Diabetes Care 2006;29:2427–2432 - PubMed
-
- Kahn SE, Hull RL, Utzschneider KM. Mechanisms linking obesity to insulin resistance and type 2 diabetes. Nature 2006;444:840–846 - PubMed
-
- Rung J, Cauchi S, Albrechtsen A, et al. Genetic variant near IRS1 is associated with type 2 diabetes, insulin resistance and hyperinsulinemia. Nat Genet 2009;41:1110–1115 - PubMed
Publication types
MeSH terms
Substances
Grants and funding
LinkOut - more resources
Full Text Sources
Medical
