. 2010 Apr 9;285(15):11178-87.
doi: 10.1074/jbc.M109.092973. Epub 2010 Jan 22.

Hereditary sensory neuropathy type 1 is caused by the accumulation of two neurotoxic sphingolipids

Affiliations

Hereditary sensory neuropathy type 1 is caused by the accumulation of two neurotoxic sphingolipids

Anke Penno et al. J Biol Chem. .

Abstract

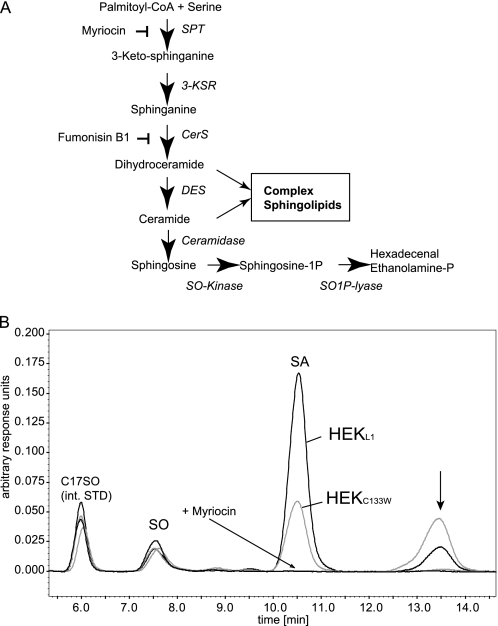
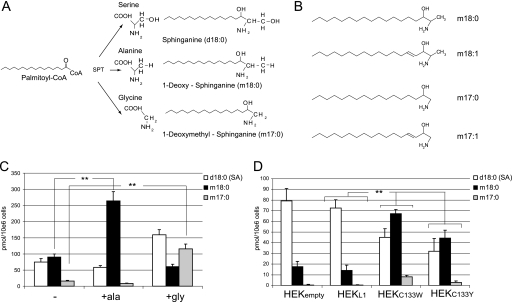
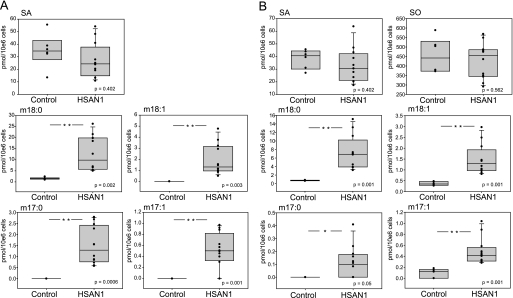
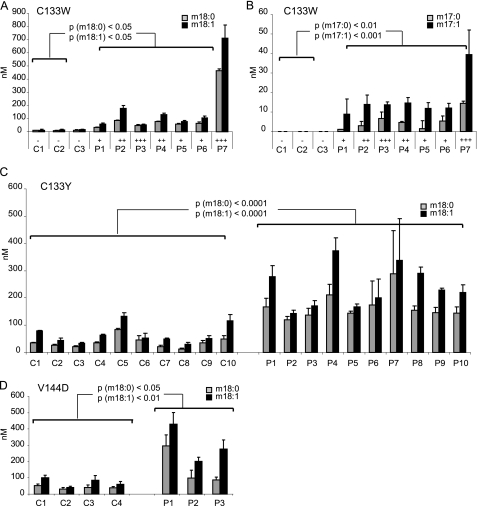
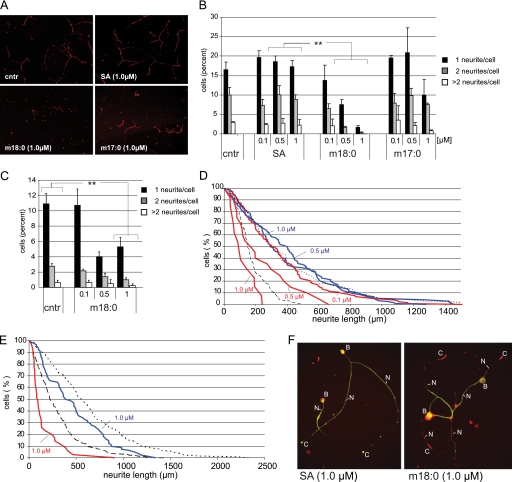
HSAN1 is an inherited neuropathy found to be associated with several missense mutations in the SPTLC1 subunit of serine palmitoyltransferase (SPT). SPT catalyzes the condensation of serine and palmitoyl-CoA, the initial step in the de novo synthesis of sphingolipids. Here we show that the HSAN1 mutations induce a shift in the substrate specificity of SPT, which leads to the formation of the two atypical deoxy-sphingoid bases (DSBs) 1-deoxy-sphinganine and 1-deoxymethyl-sphinganine. Both metabolites lack the C(1) hydroxyl group of sphinganine and can therefore neither be converted to complex sphingolipids nor degraded. Consequently, they accumulate in the cell, as demonstrated in HEK293 cells overexpressing mutant SPTLC1 and lymphoblasts of HSAN1 patients. Elevated DSB levels were also found in the plasma of HSAN1 patients and confirmed in three groups of HSAN1 patients with different SPTLC1 mutations. The DSBs show pronounced neurotoxic effects on neurite formation in cultured sensory neurons. The neurotoxicity co-occurs with a disturbed neurofilament structure in neurites when cultured in the presence of DSBs. Based on these observations, we conclude that HSAN1 is caused by a gain of function mutation, which results in the formation of two atypical and neurotoxic sphingolipid metabolites.


Figures

FIGURE 1.
FIGURE 1.
A, de novo sphingolipid synthesis pathway. De novo ceramide synthesis involves several steps. SPT catalyzes the initial conjugation of palmitoyl-CoA with l-serine to form 3-keto-sphinganine, which is subsequently reduced to SA. SA is acetylated by ceramide synthase (CerS) and desaturated by ceramide desaturase (DES) to form ceramide. The degradation pathway starts with the deacetylation of ceramide by ceramidase. The formed SO is then phosphorylated by SO-kinase and finally degraded to hexadecenal and phosphoethanolamine by the action of the sphingosine-1-phospate lyase (SO1P lyase). B, HEK293 cells expressing the SPT-C133W mutant generate an unknown metabolite. HEK293 cells were transfected with either wild-type SPTLC1 or the SPTLC1-C133W mutant. De novo synthesis was blocked with FB1 for 24 h. This causes an accumulation of sphinganine but also of other potential SPT products. The accumulated sphingoid bases were extracted and analyzed by HPLC. We observed a significant accumulation of SA in HEKL1 cells (black). SA accumulation was lower in HEKC133W cells (gray), which reflects the reduced activity of the mutant. In parallel, we observed the appearance of a second, unknown peak (arrow). This peak appeared only in the presence of FB1 and was increased in cells expressing the C133W mutant. It was absent when SPT activity was blocked with myriocin. int. STD, internal standard.
FIGURE 2.
FIGURE 2.
A, products of the SPT reaction using serine, alanine, or glycine as substrates. The conjugation of palmitoyl-CoA with alanine and glycine leads to the formation of the two DSBs: m18:0 and m17:0. B, chemical structure of the DSBs. An abbreviated nomenclature for sphingoid bases is used in this work. The numbers of hydroxyls are designated by m (for mono-) and d (for di-) followed by the number of carbons. The second number indicates the double bonds. For example, d18:0 stands for sphinganine, and d18:1 stands for sphingosine. All shown metabolites were also found in the N-acetylated form. C, accumulation of m18:0 and m17:0 in HEKC133W cells after supplementing the culture medium with alanine or glycine. HEKC133W cells were cultured using either standard medium (−) or medium that was supplemented with 10 mm alanine (+ala) or 10 mm glycine (+gly). De novo synthesis was blocked with FB1 for 24 h, and the accumulated lipids were analyzed by LC-MS. D, accumulation of DSB in HEK cells expressing mutant forms of SPT. HEKempty, HEKL1, HEKC133W, and HEKC133Y cells were treated with FB1 for 24 h, and the extracted lipids were quantified by LC-MS. Error bars in C and D indicate S.E. p values ≤ 0.01 were labeled with **.
FIGURE 3.
FIGURE 3.
Accumulation of DSBs in EBV-transformed lymphoblasts of HSAN1 patients. A, the de novo synthesis of DSBs was compared between EBV-transformed lymphoblasts from 12 HSAN1 patients (all C133W carriers) and six healthy controls. Lymphoblasts were cultured for 24 h in the presence of FB1, and lipids were extracted, base-hydrolyzed, and analyzed by LC-MS. SO was not detected in the lymphoblasts. B, sphingoid base levels in total lipid extracts of lymphoblasts from HSAN1 patients and healthy controls. Total cellular lipids were extracted and subjected to acid/base hydrolysis. The resulting free sphingoid bases were analyzed by LC-MS. No significant differences were seen in the total amounts of SA or SO, whereas the concentration of m17:0, m17:1, m18:0, and m18:1 was significantly higher in the HSAN1 lymphoblasts when compared with control cells. In A and B, p values ≤ 0.05 were labeled with *.
FIGURE 4.
FIGURE 4.
DSB plasma levels in HSAN1 patients and healthy controls. A, total plasma lipids from seven HSAN1 patients (C133W carriers) and three unrelated healthy controls were extracted and subjected to acid and base hydrolysis. P1–7, plasma of HSAN1 patients; C1–7, control plasma. B, the m17 sphingoid bases were only detected in the plasma of HSAN1 patients. No m17 bases were found in control plasma. The symbols are: −, not affected; +, mildly affected, ++, moderately affected, +++, severely affected. C, comparison of m18:0 and m18:1 levels in affected (P1–10) and unaffected members (C1–10) of a C133Y family. All C133Y carriers showed significantly higher m18:0 and m18:1 levels when compared with family members who do not carry the mutation. No m17 sphingoid bases were detected in the plasma of the C133Y patients. D, m18:0 and m18:1 sphingoid bases were also significantly elevated in three carriers of a V144D mutation (P1–3) when compared with four non-carriers (C1–4). No m17 sphingoid bases were detected in the V144D carriers. Error bars indicate S.E.
FIGURE 5.
FIGURE 5.
A, effect of SA, m18:0, and m17:0 on cultured DRG neurons. Dissociated sensory neurons were grown for 12 h in control medium before the lipids were added for another 24 h. The addition of SA (1 μm) had no effect on neurite number and length when compared with controls (cntr = BSA without lipids). In the presence of m18:0 (1 μm), the cells showed a greatly reduced number of neurites. The addition of m17:0 (1 μm) showed a similar but less pronounced effect. B, quantitative analysis of the formed neurites in the presence of SA, m18:0, and m17:0. The presence of SA had no significant effect on neurite outgrowth, whereas the presence of m18:0 clearly reduced the number of neurites in a dose-dependent manner. A similar effect was observed for m17:0 whereby the presence of m17:0 mainly affected cells with two and more neurites. C, effect of m18:0 on neurite formation in cultured motoneurons. Like sensory neurons, we observed a significant reduction of neurite numbers in the presence of m18:0. However, this reduction was less pronounced at higher m18:0 concentrations in motoneurons than in sensory neurons. Error bars in B and C indicate S.E., and p values ≤ 0.01 were labeled with **. D, distribution of neurite lengths in the presence of SA and deoxy-SA (m18:0) in sensory neurons. The distribution of neurite length was plotted as the percentage of neurons with neurites longer than a given length (y axis) versus neurite length (x axis) as introduced by Chang et al. (21). The length was measured as total neurite length elaborated per neuron. Neurons were cultured for 12 h prior to the addition of the lipids (dashed line). The presence of SA (1 and 0.5 μm, blue) showed no reduction in the length of the formed neurites when compared with the control (BSA alone, dotted line). The presence of m18:0 significantly reduced neurite length in a dose-dependent manner (red lines). No difference to the control was seen with 0.1 μm m18:0. In the presence of 0.5 and 1 μm m18:0, we observed a significant shortening of the neurites in a dose-dependent manner. At the highest m18:0 concentrations tested (1 μm), the neurites were even shorter than at the time the lipids were added (dashed line, neurite length prior to the addition of the lipids). E, the presence of m18:0 induced neurite retraction. Cells were cultured for 24 h prior to the addition of the lipids (dashed line). In the presence of SA (1 μm, blue line), the neurites continued growing, although the growth rate was a little diminished in comparison with the control (dotted line). In contrast, the addition of m18:0 (1 μm, red line) induced a significant retraction of the formed neurites. F, this effect was confirmed by immune fluorescence microscopy of sensory neurons that were cultured in the presence of SA or m18:0 (1 μm each, 24 h). The SA-treated cells looked healthy and showed a clear co-localization of actin (red) and neurofilament (green) over the whole length of the neurite (left panel). In contrast, m18:0-treated neurons showed a disruption of the neurite structure with a retraction of neurofilament and a disturbed actin-neurofilament interaction (right panel). B, cell body; N, neurite; C, growth cone.

Similar articles

Cited by

References

    1. Auer-Grumbach M., Mauko B., Auer-Grumbach P., Pieber T. R. (2006) Neuromolecular. Med. 8, 147–158 - PubMed
    1. Auer-Grumbach M. (2008) Orphanet. J. Rare Dis. 3, 7. - PMC - PubMed
    1. Dawkins J. L., Hulme D. J., Brahmbhatt S. B., Auer-Grumbach M., Nicholson G. A. (2001) Nat. Genet. 27, 309–312 - PubMed
    1. Bejaoui K., Wu C., Scheffler M. D., Haan G., Ashby P., Wu L., de Jong P., Brown R. H., Jr. (2001) Nat. Genet. 27, 261–262 - PubMed
    1. Hanada K., Hara T., Fukasawa M., Yamaji A., Umeda M., Nishijima M. (1998) J. Biol. Chem. 273, 33787–33794 - PubMed

Publication types