

Software tool for researching annotations of proteins: open-source protein annotation software with data visualization
- PMID: 19839595
- PMCID: PMC2787672
- DOI: 10.1021/ac901335x
Software tool for researching annotations of proteins: open-source protein annotation software with data visualization
Abstract
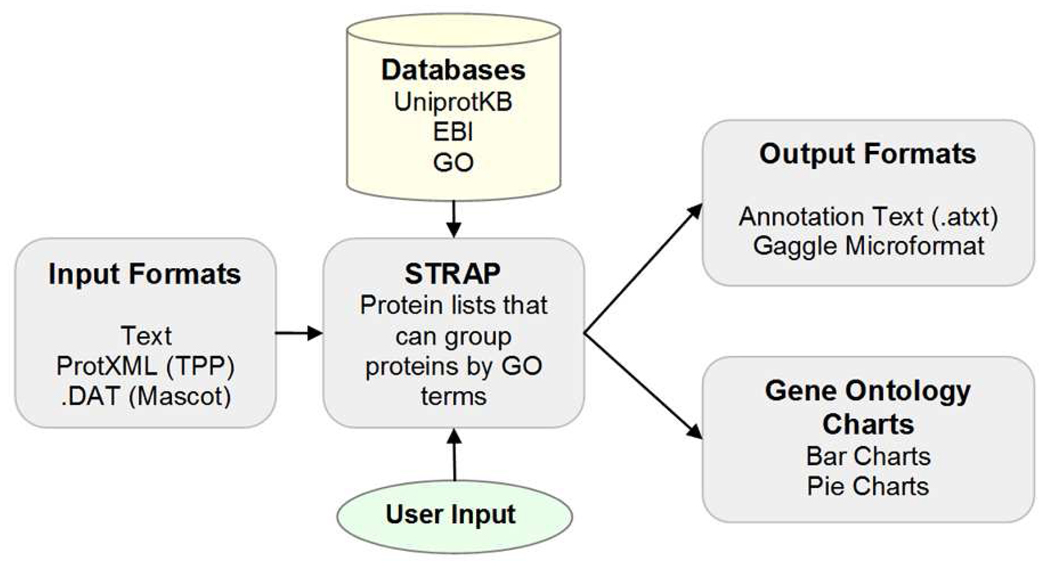
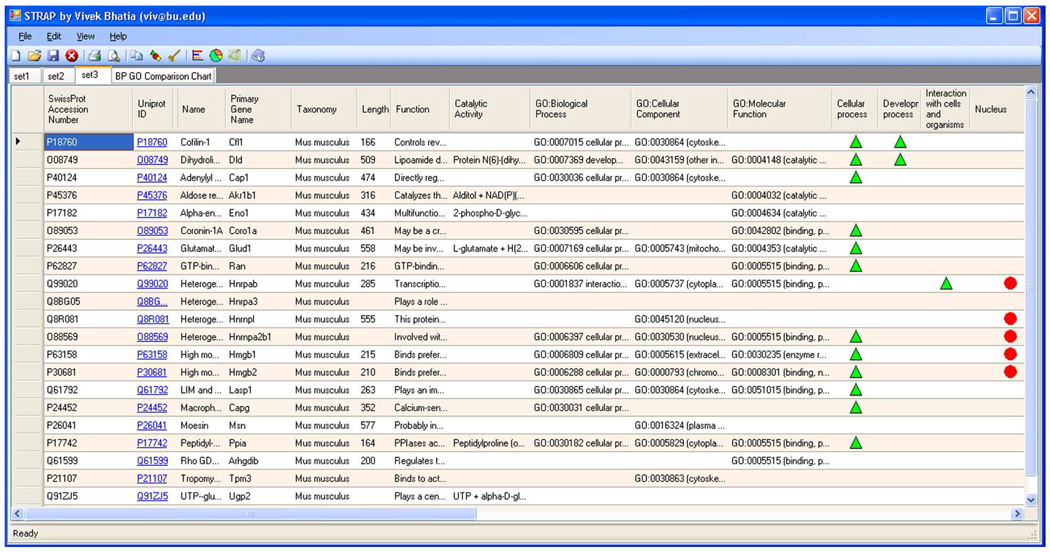
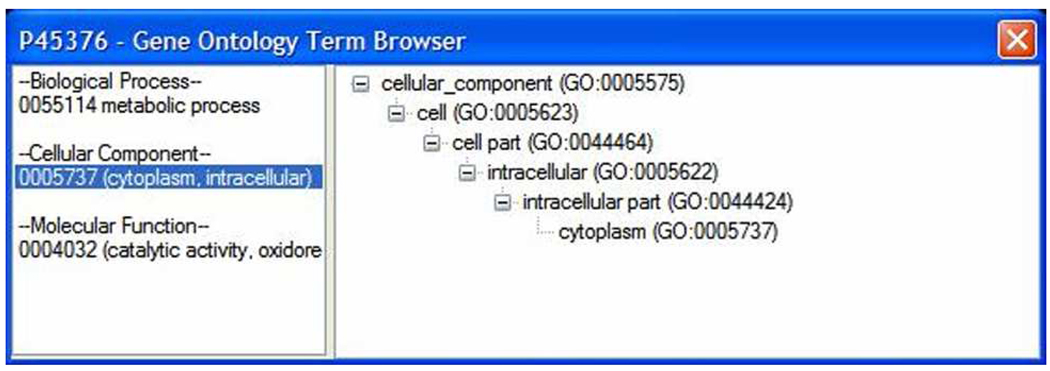
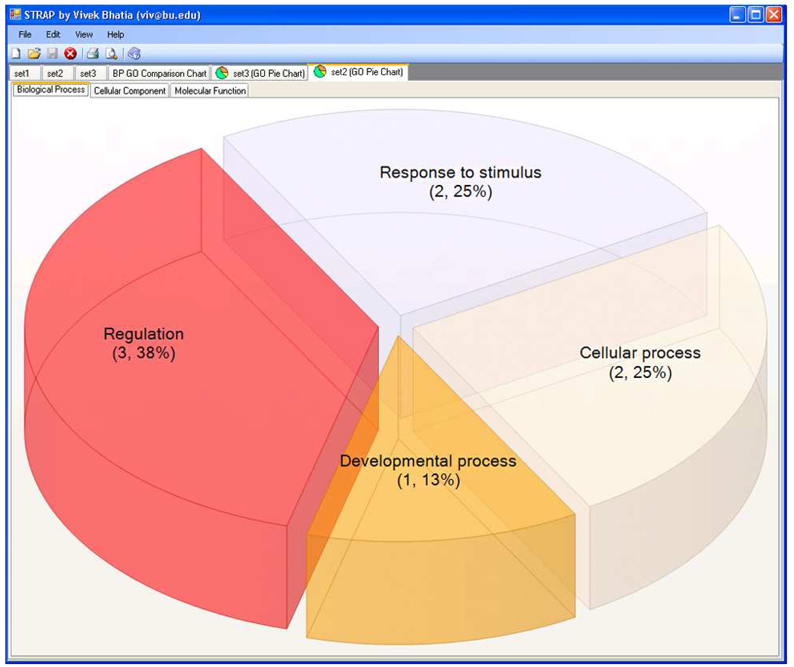
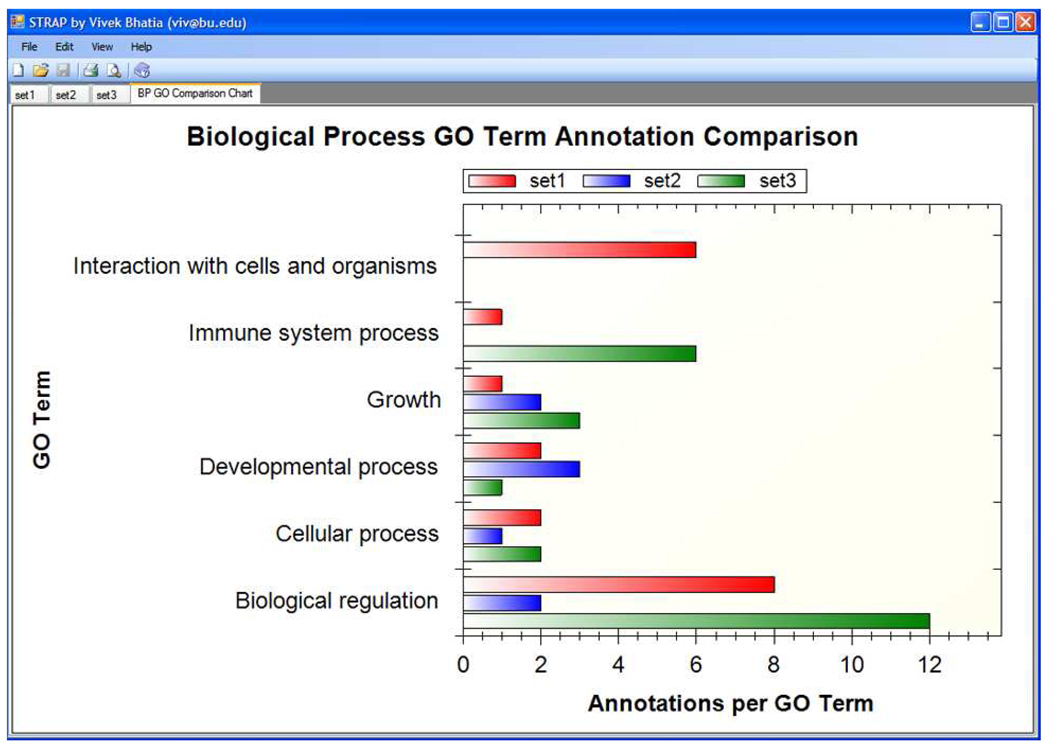
In order that biological meaning may be derived and testable hypotheses may be built from proteomics experiments, assignments of proteins identified by mass spectrometry or other techniques must be supplemented with additional notation, such as information on known protein functions, protein-protein interactions, or biological pathway associations. Collecting, organizing, and interpreting this data often requires the input of experts in the biological field of study, in addition to the time-consuming search for and compilation of information from online protein databases. Furthermore, visualizing this bulk of information can be challenging due to the limited availability of easy-to-use and freely available tools for this process. In response to these constraints, we have undertaken the design of software to automate annotation and visualization of proteomics data in order to accelerate the pace of research. Here we present the Software Tool for Researching Annotations of Proteins (STRAP), a user-friendly, open-source C# application. STRAP automatically obtains gene ontology (GO) terms associated with proteins in a proteomics results ID list using the freely accessible UniProtKB and EBI GOA databases. Summarized in an easy-to-navigate tabular format, STRAP results include meta-information on the protein in addition to complementary GO terminology. Additionally, this information can be edited by the user so that in-house expertise on particular proteins may be integrated into the larger data set. STRAP provides a sortable tabular view for all terms, as well as graphical representations of GO-term association data in pie charts (biological process, cellular component, and molecular function) and bar charts (cross comparison of sample sets) to aid in the interpretation of large data sets and differential analyses experiments. Furthermore, proteins of interest may be exported as a unique FASTA-formatted file to allow for customizable re-searching of mass spectrometry data, and gene names corresponding to the proteins in the lists may be encoded in the Gaggle microformat for further characterization, including pathway analysis. STRAP, a tutorial, and the C# source code are freely available from http://cpctools.sourceforge.net.
Figures
Similar articles
-
The Gene Ontology Annotation (GOA) Database: sharing knowledge in Uniprot with Gene Ontology.Nucleic Acids Res. 2004 Jan 1;32(Database issue):D262-6. doi: 10.1093/nar/gkh021. Nucleic Acids Res. 2004. PMID: 14681408 Free PMC article.
-
FunMappOne: a tool to hierarchically organize and visually navigate functional gene annotations in multiple experiments.BMC Bioinformatics. 2019 Feb 15;20(1):79. doi: 10.1186/s12859-019-2639-2. BMC Bioinformatics. 2019. PMID: 30767762 Free PMC article.
-
GOLEM: an interactive graph-based gene-ontology navigation and analysis tool.BMC Bioinformatics. 2006 Oct 10;7:443. doi: 10.1186/1471-2105-7-443. BMC Bioinformatics. 2006. PMID: 17032457 Free PMC article.
-
A simple recipe for the non-expert bioinformaticist for building experimentally-testable hypotheses for proteins with no known homologs.J Struct Funct Genomics. 2012 Dec;13(4):185-200. doi: 10.1007/s10969-012-9141-7. Epub 2012 Sep 7. J Struct Funct Genomics. 2012. PMID: 22956349 Review.
-
Open source libraries and frameworks for biological data visualisation: a guide for developers.Proteomics. 2015 Apr;15(8):1356-74. doi: 10.1002/pmic.201400377. Epub 2015 Feb 5. Proteomics. 2015. PMID: 25475079 Free PMC article. Review.
Cited by
-
Constitutive and inflammatory immunopeptidome of pancreatic β-cells.Diabetes. 2012 Nov;61(11):3018-25. doi: 10.2337/db11-1333. Epub 2012 Aug 7. Diabetes. 2012. PMID: 22872234 Free PMC article.
-
VqDUF642, a gene isolated from the Chinese grape Vitis quinquangularis, is involved in berry development and pathogen resistance.Planta. 2016 Nov;244(5):1075-1094. doi: 10.1007/s00425-016-2569-4. Epub 2016 Jul 16. Planta. 2016. PMID: 27424038
-
Proteomics analysis of the zebrafish skeletal extracellular matrix.PLoS One. 2014 Mar 7;9(3):e90568. doi: 10.1371/journal.pone.0090568. eCollection 2014. PLoS One. 2014. PMID: 24608635 Free PMC article.
-
Identification of Biomarkers for Resistance to Fusarium oxysporum f. sp. cubense Infection and in Silico Studies in Musa paradisiaca Cultivar Puttabale through Proteomic Approach.Proteomes. 2016 Feb 24;4(1):9. doi: 10.3390/proteomes4010009. Proteomes. 2016. PMID: 28248219 Free PMC article.
-
Engineered Aminoacyl-tRNA Synthetase for Cell-Selective Analysis of Mammalian Protein Synthesis.J Am Chem Soc. 2016 Apr 6;138(13):4278-81. doi: 10.1021/jacs.5b08980. Epub 2016 Mar 25. J Am Chem Soc. 2016. PMID: 26991063 Free PMC article.
References
-
- Falkner JA, Falkner JW, Andrews PC. Bioinformatics. 2006;22:632–633. - PubMed
Publication types
MeSH terms
Substances
Grants and funding
LinkOut - more resources
Full Text Sources
Other Literature Sources
