

doi: 10.1083/jcb.200810159.
Epub 2009 Jun 22.
Microcephalin and pericentrin regulate mitotic entry via centrosome-associated Chk1
Affiliations
- PMID: 19546241
- PMCID: PMC2712957
- DOI: 10.1083/jcb.200810159
Item in Clipboard
Microcephalin and pericentrin regulate mitotic entry via centrosome-associated Chk1
J Cell Biol.
.
Abstract
Primary microcephaly, Seckel syndrome, and microcephalic osteodysplastic primordial dwarfism type II (MOPD II) are disorders exhibiting marked microcephaly, with small brain sizes reflecting reduced neuron production during fetal life. Although primary microcephaly can be caused by mutations in microcephalin (MCPH1), cells from patients with Seckel syndrome and MOPD II harbor mutations in ataxia telangiectasia and Rad3 related (ATR) or pericentrin (PCNT), leading to disturbed ATR signaling. In this study, we show that a lack of MCPH1 or PCNT results in a loss of Chk1 from centrosomes with subsequently deregulated activation of centrosomal cyclin B-Cdk1.
Figures
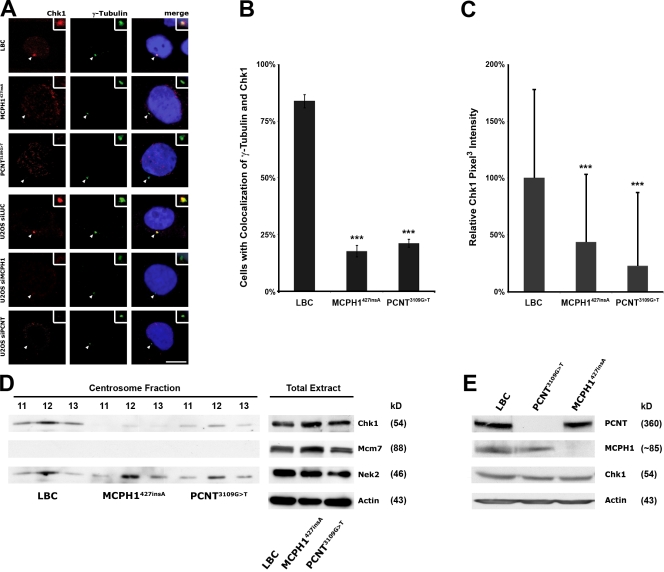
Chk1 levels are reduced at centrosomes in both MCPH1- and PCNT-deficient cells. (A) Normal, MCPH1427insA, and PCNT3109G>T LBCs as well as U2OS cells transfected with luciferase- (as control [siLUC]), MCPH1-, or PCNT-specific siRNA were costained with mouse anti-Chk1 (red) and rabbit anti–γ-tubulin (green) antibodies and analyzed by confocal microscopy. Bar, 10 µm. (B) The mean percentages of cells with centrosomal colocalization of γ-tubulin and Chk1 are indicated. Error bars represent the standard deviation after combining the results of three different experiments. Statistical significance versus control (LBC) by two-tailed Student's t test is as follows: ***, P = 9 × 10⁻⁶ (MCPH1427insA); P = 0.00003 (PCNT3109G>T). (C) Quantification of pixel intensity profiles constructed from optically sectioned (z axis) fluorescence images of control, MCPH1427insA, and PCNT3109G>T LBCs. Error bars represent standard deviations from the analysis of 100 cells. Statistical significance versus control (LBC) by two-tailed Student's t test is as follows: ***, P = 1.4 × 10⁻⁷ (MCPH1427insA); P = 9.8 × 10⁻¹² (PCNT3109G>T). (D) Loss of Chk1 protein in isolated centrosome preparations. Immunoblots were performed on three sucrose gradient fractions of centrosome preparations (left) and whole cell lysates (right) as an input control from normal, MCPH1427insA, and PCNT3109G>T LBCs using antibodies against Chk1 and, for comparison, Nek2 (a centrosomal protein) and Mcm7 (a nuclear protein). For whole cell lysates, actin was included as a loading control. (E) Western blot analysis of PCNT, MCPH1, and Chk1 in whole cell lysates from control, MCPH1427insA, and PCNT3109G>T LBCs. Actin was included as a loading control. Arrowheads point to centrosomes, which are shown enlarged in insets.
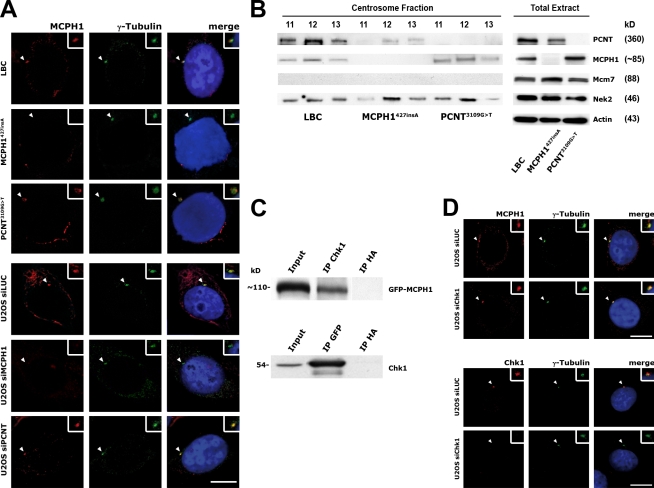
MCPH1 interacts with and targets Chk1 to the centrosome. (A) Control, MCPH1427insA, and PCNT3109G>T LBCs as well as U2OS cells transfected with luciferase- (as control [siLUC]), MCPH1-, or PCNT-specific siRNA were costained with mouse anti-MCPH1 (red) and rabbit anti–γ-tubulin (green) antibodies and analyzed by confocal microscopy. (B) Reduced levels of PCNT in isolated centrosome preparations from MCPH1427insA LBCs. Immunoblots were performed on three sucrose gradient fractions of centrosome preparations (left) and whole cell lysates (right) as an input control from normal, MCPH1427insA, and PCNT3109G>T LBCs using antibodies against PCNT, MCPH1, and, for comparison, Nek2 as a loading control and Mcm7 to exclude nuclear contamination. For whole cell lysates, actin was included as a loading control. (C) Transiently expressed GFP-MCPH1 and Chk1 interact with each other in vivo. Chk1 was immunoprecipitated from U2OS cells 24 h after transient transfection with GFP-MCPH1. Reciprocally, GFP-MCPH1 was immunoprecipitated using an anti-GFP antibody. Immunoprecipitation with an anti-HA antibody served as a negative control. Input represents 10% of the amount used for immunoprecipitation. White lines indicate that intervening lanes have been spliced out. (D) Depletion of Chk1 does not impact on centrosomal MCPH1 levels. U2OS cells transfected with either luciferase- or Chk1-specific siRNA were costained with mouse anti-MCPH1 (red) and rabbit anti–γ-tubulin (green) antibodies (top) or mouse anti-Chk1 (red) and rabbit anti–γ-tubulin (green) antibodies (bottom) and analyzed by confocal microscopy. Arrowheads point to centrosomes, which are shown enlarged in insets. Bars, 10 µm.
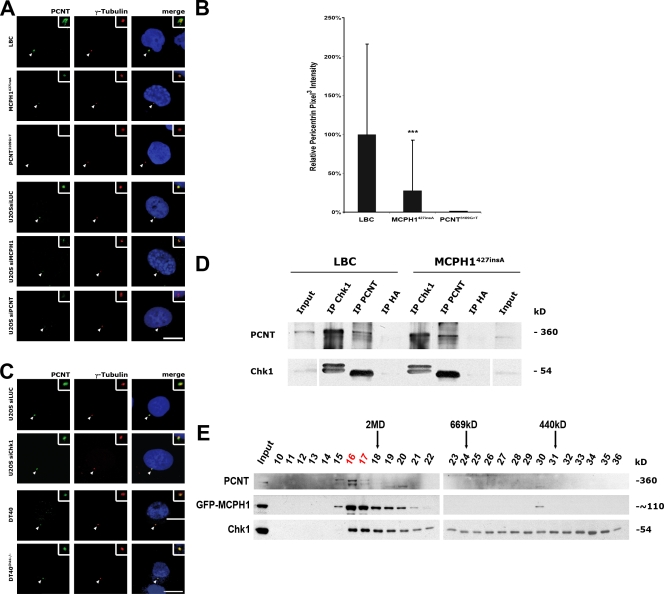
MCPH1 recruits Chk1 to the centrosome via PCNT. (A) Centrosomal PCNT levels are reduced in MCPH1427insA and PCNT3109G>T LBCs relative to control lymphoblasts. Normal, MCPH1427insA, and PCNT3109G>T LBCs as well as U2OS cells transfected with luciferase- (as control [siLUC]), MCPH1-, or PCNT-specific siRNA were costained with rabbit anti-PCNT (green) and mouse anti–γ-tubulin (red) antibodies and analyzed by confocal microscopy. (B) Quantification of pixel intensity profiles constructed from optically sectioned (z axis) fluorescence images of normal cells. Error bars represent standard deviations from the analysis of 100 cells. Statistical significance versus control (LBC) by two-tailed Student's t test is as follows: ***, P = 7.2 × 10⁻⁶ (MCPH1427insA). (C) Control and Chk1−/− chicken DT40 cells as well as U2OS cells transfected with luciferase- or Chk1-specific siRNA were costained with rabbit anti-PCNT (green) and mouse anti–γ-tubulin (red) and analyzed by confocal microscopy. (D) Endogenous PCNT and Chk1 interact with each other in vivo. Endogenous Chk1 was detected in immunoprecipitates using an anti-PCNT antibody in both control and MCPH1427insA LBCs. Reciprocally, endogenous PCNT was detectable after immunoprecipitation of Chk1 in both cell lines as well. Immunoprecipitation with an anti-HA antibody served as a negative control. Input represents 10% of the amount used for immunoprecipitation. White lines indicate that intervening lanes have been spliced out. (E) Cofractionation of PCNT, MCPH1, and Chk1 in U2OS whole cell lysates. Lysates were prepared from U2OS cells transiently transfected with GFP-MCPH1 24 h before lysis and size fractionated by fast protein liquid chromatography using a Superose 6 column. Proteins from consecutive fractions were analyzed by Western blotting using antibodies to PCNT, GFP, and Chk1. The size of marker proteins is shown on top. Numbers in red indicate the fractions that contain all three proteins (GFP-MCPH1, PCNT, and Chk1). Arrowheads point to centrosomes, which are shown enlarged in insets. Bars, 10 µm.
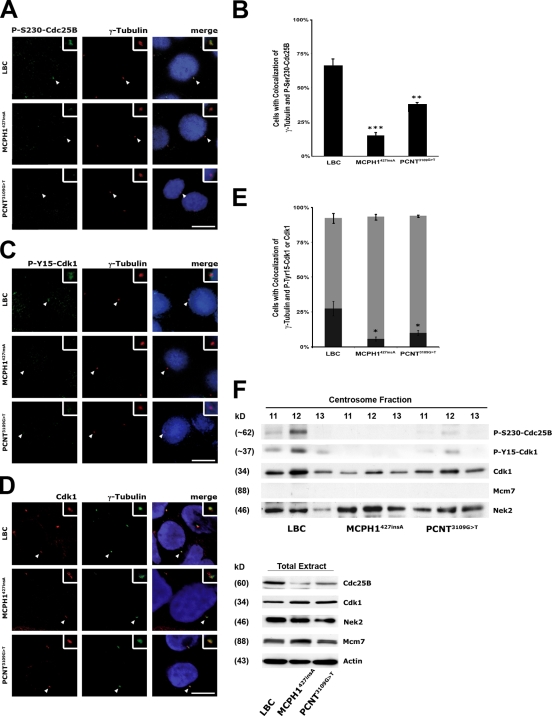
Loss of Chk1 from centrosomes induces activation of centrosome-associated Cdc25B and Cdk1. (A, C, and D) Normal, MCPH1427insA, and PCNT3109G>T LBCs were synchronized in G1/early S phase by a mimosine block, released for 8 h to reach G2 phase, and subsequently costained with rabbit anti–P-S230-Cdc25B (green) and mouse anti–γ-tubulin (red) antibodies (A), rabbit anti–P-Y15-Cdk1 (green) and mouse anti–γ-tubulin (red) antibodies (C), or mouse anti-Cdk1 (red) and rabbit anti–γ-tubulin (green) antibodies (D) and analyzed by confocal microscopy. (B) Loss of Chk1 from centrosomes induces activation of centrosome-associated Cdc25B. The mean percentages of cells with centrosomal colocalization of γ-tubulin and P-S230-Cdc25B are indicated. Statistical significance versus control (LBC) by two-tailed Student's t test is as follows: ***, P = 0.0006 (MCPH1427insA); **, P = 0.006 (PCNT3109G>T). (E) Loss of Chk1 from centrosomes induces activation of centrosome-associated Cdk1. The mean percentages of cells with centrosomal colocalization of γ-tubulin and total Cdk1 (light gray bars) or P-Y15-Cdk1 (dark gray bars) are indicated. Statistical significance versus control (LBC) by two-tailed Student's t test is as follows: *, P = 0.013 (MCPH1427insA); P = 0.019 (PCNT3109G>T). (F) Reduced levels of P-S230-Cdc25B and P-Y15-Cdk1 in isolated centrosome preparations from MCPH1427insA and PCNT3109G>T LBCs. Immunoblots were performed on three sucrose centrifugation fractions of centrosome preparations (left) and whole cell lysates (right) as an input control from control (LBC), MCPH1427insA, and PCNT3109G>T LBCs using antibodies against P-S230-Cdc25B, P-Y15-Cdk1, Cdk1, and, for comparison, Nek2 as a loading control and Mcm7 to exclude nuclear contamination. For whole cell lysates, antibodies to Cdc25B, Cdk1, and actin were included. Arrowheads point to centrosomes, which are shown enlarged in insets. Error bars represent the standard deviation after combining the results of three different experiments. Bars, 10 µm.
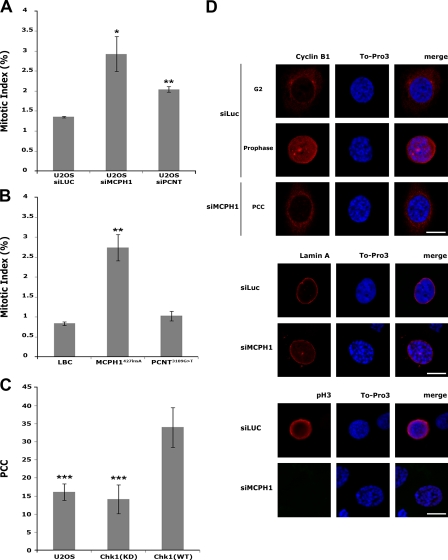
Down-regulation of MCPH1 induces premature entry into mitosis via depletion of centrosomal Chk1. (A and B) U2OS cells transfected with luciferase- (as control [siLUC]), MCPH1-, or PCNT-specific siRNA (A) as well as normal, MCPH1427insA, and PCNT3109G>T LBCs (B) were costained with propidium iodide and anti–P-S10–histone H3 and analyzed by fluorescence-activated cell sorting to quantify cells in mitosis. Statistical significance versus control by two-tailed Student's t test is as follows: (A) *, P = 0.02 (U2OS-siMCPH1); **, P = 0.001 (U2OS-siPCNT); (B) **, P = 0.009 (MCPH1427insA); P = 0.09 (PCNT3109G>T). (C) Parental U2OS cells or U2OS cells conditionally expressing wild-type (Chk1[WT]) or kinase-dead (Chk1[KD]) GFP-Chk1-PACT were transfected with MCPH1-specific siRNA and analyzed by fluorescence microscopy. The mean percentages of cells with PCC are indicated. Statistical significance versus Chk1(WT) by two-tailed Student's t test is as follows: ***, P = 0.0008 (U2OS); P = 0.0002 (Chk1[KD]). (D) Characterization of the PCC phenotype. U2OS cells were transfected with luciferase- or MCPH1-specific siRNA and immunostained with antibodies to cyclin B1 (top), lamin A (middle), and P-S10–histone H3 (pH3; bottom). DNA was counterstained with To-Pro 3. After transfection with MCPH1-specific siRNA, PCC cells have an intact nuclear membrane as judged by lamin A staining, are P-S10–histone H3 negative, and show no nuclear cyclin B1 accumulation, thereby demonstrating that they exhibit G2 rather than mitotic characteristics. Error bars represent the standard deviation after combining the results of three different experiments. Bars, 10 µm.
Similar articles
-
Regulation of mitotic entry by microcephalin and its overlap with ATR signalling.Nat Cell Biol. 2006 Jul;8(7):725-33. doi: 10.1038/ncb1431. Epub 2006 Jun 18. Nat Cell Biol. 2006. PMID: 16783362
-
MCPH1 regulates the neuroprogenitor division mode by coupling the centrosomal cycle with mitotic entry through the Chk1-Cdc25 pathway.Nat Cell Biol. 2011 Sep 25;13(11):1325-34. doi: 10.1038/ncb2342. Nat Cell Biol. 2011. PMID: 21947081
-
Centrosomal Che-1 protein is involved in the regulation of mitosis and DNA damage response by mediating pericentrin (PCNT)-dependent Chk1 protein localization.J Biol Chem. 2013 Aug 9;288(32):23348-57. doi: 10.1074/jbc.M113.465302. Epub 2013 Jun 24. J Biol Chem. 2013. PMID: 23798705 Free PMC article.
-
Microcephalin: a causal link between impaired damage response signalling and microcephaly.Cell Cycle. 2006 Oct;5(20):2339-44. doi: 10.4161/cc.5.20.3358. Epub 2006 Oct 16. Cell Cycle. 2006. PMID: 17102619 Review.
-
Consequences of Centrosome Dysfunction During Brain Development.Adv Exp Med Biol. 2017;1002:19-45. doi: 10.1007/978-3-319-57127-0_2. Adv Exp Med Biol. 2017. PMID: 28600781 Review.
Cited by
-
Mutations in ORC1, encoding the largest subunit of the origin recognition complex, cause microcephalic primordial dwarfism resembling Meier-Gorlin syndrome.Nat Genet. 2011 Feb 27;43(4):350-5. doi: 10.1038/ng.776. Nat Genet. 2011. PMID: 21358633
-
A novel homozygous mutation of the PCNT gene in a Chinese patient with microcephalic osteodysplastic primordial dwarfism type II.Mol Genet Genomic Med. 2021 Sep;9(9):e1761. doi: 10.1002/mgg3.1761. Epub 2021 Jul 31. Mol Genet Genomic Med. 2021. PMID: 34331829 Free PMC article.
-
Cell cycle-dependent localization of CHK2 at centrosomes during mitosis.Cell Div. 2013 May 16;8(1):7. doi: 10.1186/1747-1028-8-7. Cell Div. 2013. PMID: 23680298 Free PMC article.
-
Primary microcephaly: do all roads lead to Rome?Trends Genet. 2009 Nov;25(11):501-10. doi: 10.1016/j.tig.2009.09.011. Epub 2009 Oct 21. Trends Genet. 2009. PMID: 19850369 Free PMC article. Review.
-
Mechanisms and pathways of growth failure in primordial dwarfism.Genes Dev. 2011 Oct 1;25(19):2011-24. doi: 10.1101/gad.169037. Genes Dev. 2011. PMID: 21979914 Free PMC article. Review.
References
-
- Alderton G.K., Joenje H., Varon R., Borglum A.D., Jeggo P.A., O'Driscoll M. 2004. Seckel syndrome exhibits cellular features demonstrating defects in the ATR-signalling pathway.Hum. Mol. Genet. 13:3127–3138 - PubMed
-
- Alderton G.K., Galbiati L., Griffith E., Surinya K.H., Neitzel H., Jackson A.P., Jeggo P.A., O'Driscoll M. 2006. Regulation of mitotic entry by microcephalin and its overlap with ATR signalling.Nat. Cell Biol. 8:725–733 - PubMed
-
- Bailly E., Pines J., Hunter T., Bornens M. 1992. Cytoplasmic accumulation of cyclin B1 in human cells: association with a detergent-resistant compartment within the centrosome.J. Cell Sci. 101:529–545 - PubMed
-
- Bond J., Woods C.G. 2006. Cytoskeletal genes regulating brain size.Curr. Opin. Cell Biol. 18:95–101 - PubMed
Publication types
MeSH terms
Substances
LinkOut - more resources
Full Text Sources
Research Materials
Miscellaneous
