

CLIC2-RyR1 interaction and structural characterization by cryo-electron microscopy
- PMID: 19356589
- PMCID: PMC2667806
- DOI: 10.1016/j.jmb.2009.01.059
CLIC2-RyR1 interaction and structural characterization by cryo-electron microscopy
Abstract
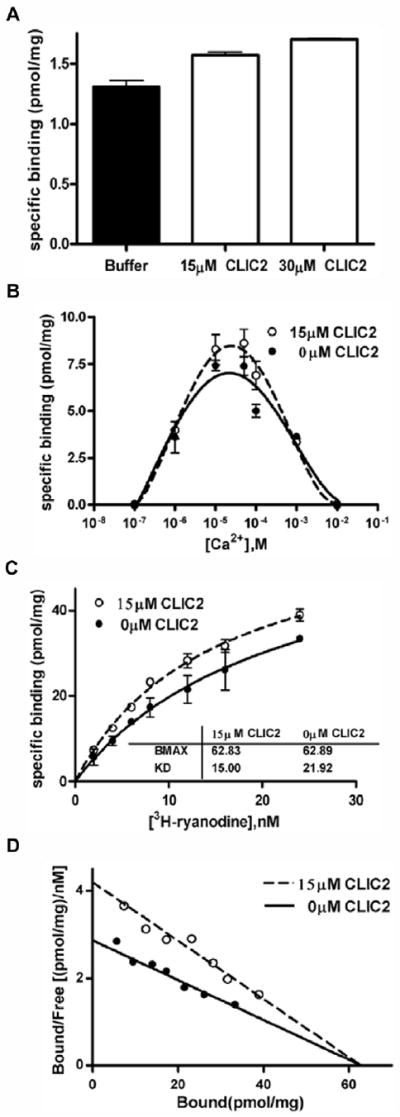
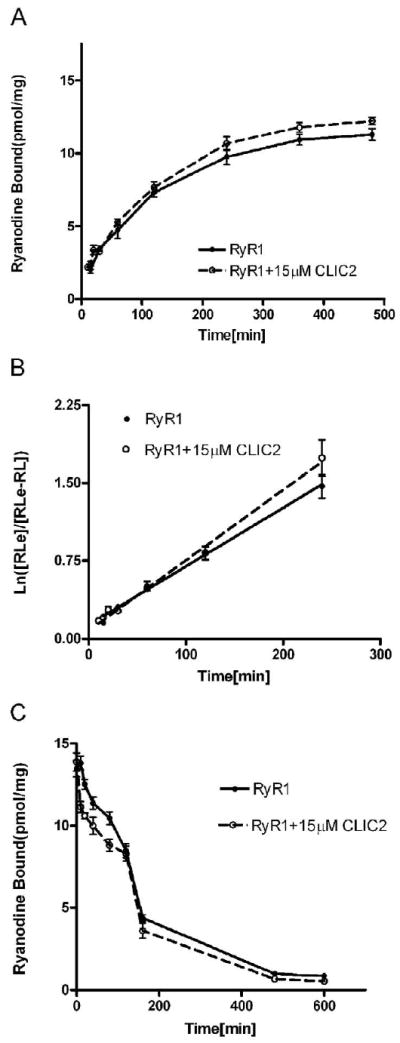
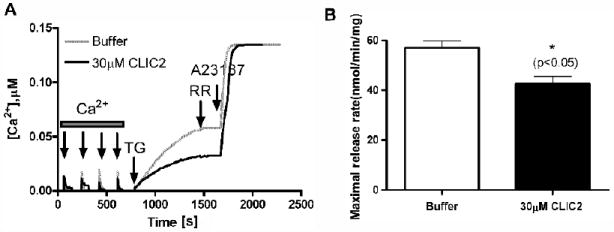
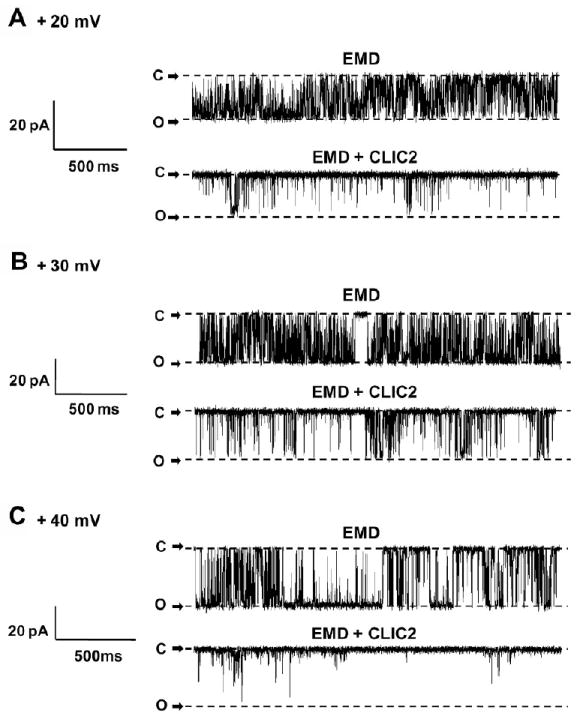
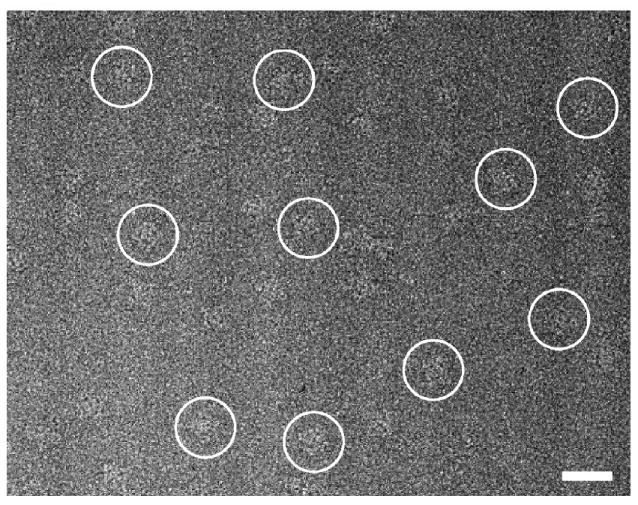
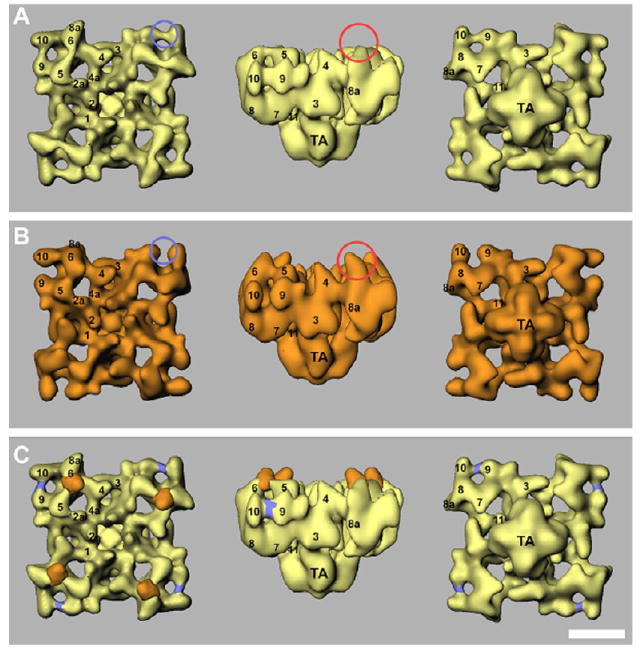
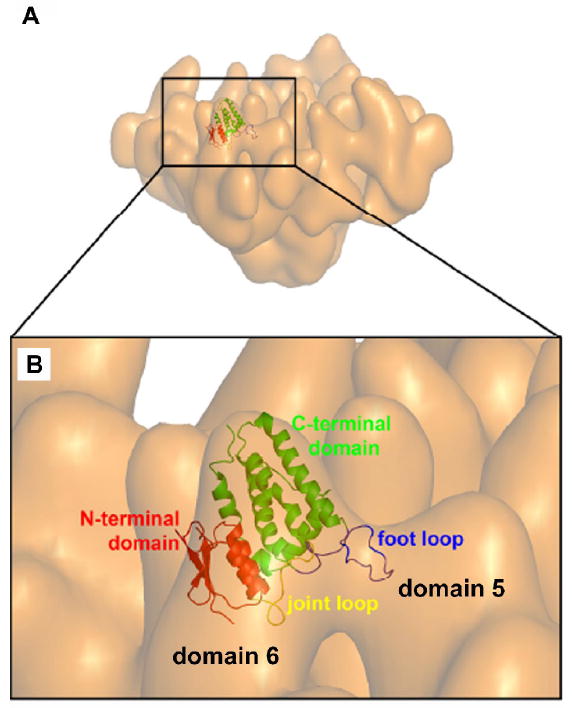
Chloride intracellular channel 2 (CLIC2), a newly discovered small protein distantly related to the glutathione transferase (GST) structural family, is highly expressed in cardiac and skeletal muscle, although its physiological function in these tissues has not been established. In the present study, [3H]ryanodine binding, Ca2+ efflux from skeletal sarcoplasmic reticulum (SR) vesicles, single channel recording, and cryo-electron microscopy were employed to investigate whether CLIC2 can interact with skeletal ryanodine receptor (RyR1) and modulate its channel activity. We found that: (1) CLIC2 facilitated [3H]ryanodine binding to skeletal SR and purified RyR1, by increasing the binding affinity of ryanodine for its receptor without significantly changing the apparent maximal binding capacity; (2) CLIC2 reduced the maximal Ca2+ efflux rate from skeletal SR vesicles; (3) CLIC2 decreased the open probability of RyR1 channel, through increasing the mean closed time of the channel; (4) CLIC2 bound to a region between domains 5 and 6 in the clamp-shaped region of RyR1; (5) and in the same clamp region, domains 9 and 10 became separated after CLIC2 binding, indicating CLIC2 induced a conformational change of RyR1. These data suggest that CLIC2 can interact with RyR1 and modulate its channel activity. We propose that CLIC2 functions as an intrinsic stabilizer of the closed state of RyR channels.
Figures


Similar articles
-
Aldolase potentiates DIDS activation of the ryanodine receptor in rabbit skeletal sarcoplasmic reticulum.Biochem J. 2006 Oct 15;399(2):325-33. doi: 10.1042/BJ20060701. Biochem J. 2006. PMID: 16817780 Free PMC article.
-
Stabilization of the skeletal muscle ryanodine receptor ion channel-FKBP12 complex by the 1,4-benzothiazepine derivative S107.PLoS One. 2013;8(1):e54208. doi: 10.1371/journal.pone.0054208. Epub 2013 Jan 17. PLoS One. 2013. PMID: 23349825 Free PMC article.
-
The cytoplasmic loops between domains II and III and domains III and IV in the skeletal muscle dihydropyridine receptor bind to a contiguous site in the skeletal muscle ryanodine receptor.J Biol Chem. 1998 Nov 6;273(45):29958-64. doi: 10.1074/jbc.273.45.29958. J Biol Chem. 1998. PMID: 9792715
-
Ca2+ stores regulate ryanodine receptor Ca2+ release channels via luminal and cytosolic Ca2+ sites.Clin Exp Pharmacol Physiol. 2007 Sep;34(9):889-96. doi: 10.1111/j.1440-1681.2007.04708.x. Clin Exp Pharmacol Physiol. 2007. PMID: 17645636 Review.
-
Structures of the colossal RyR1 calcium release channel.Curr Opin Struct Biol. 2016 Aug;39:144-152. doi: 10.1016/j.sbi.2016.09.002. Epub 2016 Sep 27. Curr Opin Struct Biol. 2016. PMID: 27687475 Free PMC article. Review.
Cited by
-
In Vitro Enzymatic Studies Reveal pH and Temperature Sensitive Properties of the CLIC Proteins.Biomolecules. 2023 Sep 15;13(9):1394. doi: 10.3390/biom13091394. Biomolecules. 2023. PMID: 37759794 Free PMC article.
-
Ligand-dependent conformational changes in the clamp region of the cardiac ryanodine receptor.J Biol Chem. 2013 Feb 8;288(6):4066-75. doi: 10.1074/jbc.M112.427864. Epub 2012 Dec 20. J Biol Chem. 2013. PMID: 23258540 Free PMC article.
-
Deformed grids for single-particle cryo-electron microscopy of specimens exhibiting a preferred orientation.J Struct Biol. 2013 Jun;182(3):255-8. doi: 10.1016/j.jsb.2013.03.005. Epub 2013 Mar 26. J Struct Biol. 2013. PMID: 23537848 Free PMC article.
-
New and notable ion-channels in the sarcoplasmic/endoplasmic reticulum: do they support the process of intracellular Ca²⁺ release?J Physiol. 2015 Aug 1;593(15):3241-51. doi: 10.1113/jphysiol.2014.281881. Epub 2014 Nov 17. J Physiol. 2015. PMID: 26228553 Free PMC article. Review.
-
Modeling a ryanodine receptor N-terminal domain connecting the central vestibule and the corner clamp region.J Biol Chem. 2013 Jan 11;288(2):903-14. doi: 10.1074/jbc.M112.429670. Epub 2012 Nov 30. J Biol Chem. 2013. PMID: 23204524 Free PMC article.
References
-
- Jentsch TJ. CLC chloride channels and transporters: from genes to protein structure, pathology and physiology. Crit Rev Biochem Mol Biol. 2008;43:3–36. - PubMed
-
- Strange K, Emma F, Jackson PS. Cellular and molecular physiology of volume-sensitive anion channels. Am J Physiol. 1996;270:C711–730. - PubMed
-
- Ashley RH. Challenging accepted ion channel biology: p64 and the CLIC family of putative intracellular anion channel proteins. Mol Membr Biol. 2003;20:1–11. - PubMed
-
- Landry D, Sullivan S, Nicolaides M, Redhead C, Edelman A, Field M, al-Awqati Q, Edwards J. Molecular cloning and characterization of p64, a chloride channel protein from kidney microsomes. J Biol Chem. 1993;268:14948–14955. - PubMed
-
- Valenzuela SM, Martin DK, Por SB, Robbins JM, Warton K, Bootcov MR, Schofield PR, Campbell TJ, Breit SN. Molecular cloning and expression of a chloride ion channel of cell nuclei. J Biol Chem. 1997;272:12575–12582. - PubMed
Publication types
MeSH terms
Substances
Grants and funding
LinkOut - more resources
Full Text Sources
Research Materials
Miscellaneous
