

Population analysis of large copy number variants and hotspots of human genetic disease
- PMID: 19166990
- PMCID: PMC2668011
- DOI: 10.1016/j.ajhg.2008.12.014
Population analysis of large copy number variants and hotspots of human genetic disease
Abstract
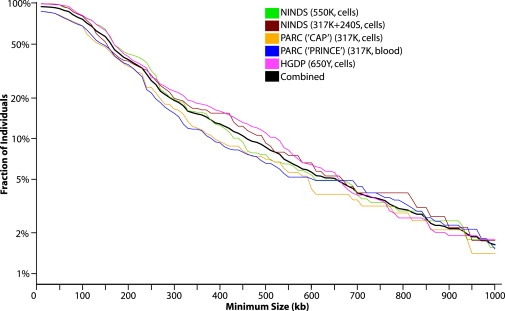
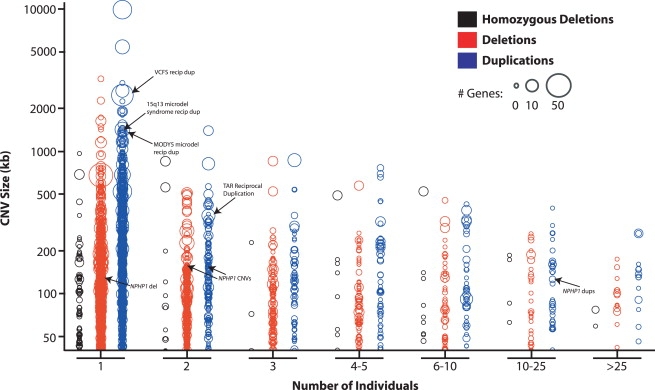
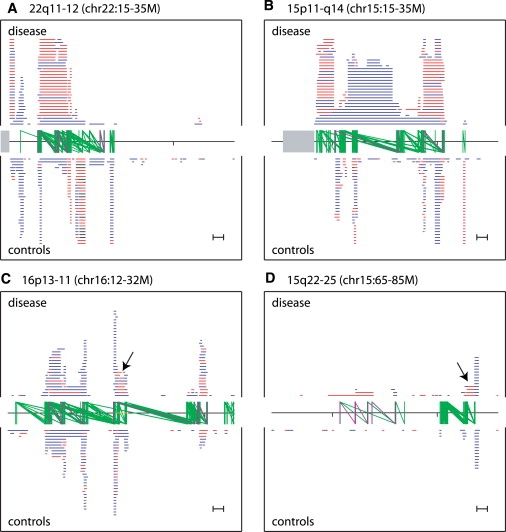
Copy number variants (CNVs) contribute to human genetic and phenotypic diversity. However, the distribution of larger CNVs in the general population remains largely unexplored. We identify large variants in approximately 2500 individuals by using Illumina SNP data, with an emphasis on "hotspots" prone to recurrent mutations. We find variants larger than 500 kb in 5%-10% of individuals and variants greater than 1 Mb in 1%-2%. In contrast to previous studies, we find limited evidence for stratification of CNVs in geographically distinct human populations. Importantly, our sample size permits a robust distinction between truly rare and polymorphic but low-frequency copy number variation. We find that a significant fraction of individual CNVs larger than 100 kb are rare and that both gene density and size are strongly anticorrelated with allele frequency. Thus, although large CNVs commonly exist in normal individuals, which suggests that size alone can not be used as a predictor of pathogenicity, such variation is generally deleterious. Considering these observations, we combine our data with published CNVs from more than 12,000 individuals contrasting control and neurological disease collections. This analysis identifies known disease loci and highlights additional CNVs (e.g., 3q29, 16p12, and 15q25.2) for further investigation. This study provides one of the first analyses of large, rare (0.1%-1%) CNVs in the general population, with insights relevant to future analyses of genetic disease.
Figures
Similar articles
-
Genotype, haplotype and copy-number variation in worldwide human populations.Nature. 2008 Feb 21;451(7181):998-1003. doi: 10.1038/nature06742. Nature. 2008. PMID: 18288195
-
Rare copy number variants implicated in posterior urethral valves.Am J Med Genet A. 2016 Mar;170(3):622-33. doi: 10.1002/ajmg.a.37493. Epub 2015 Dec 14. Am J Med Genet A. 2016. PMID: 26663319 Free PMC article.
-
Copy number variations in the genome of the Qatari population.BMC Genomics. 2015 Oct 22;16:834. doi: 10.1186/s12864-015-1991-5. BMC Genomics. 2015. PMID: 26490036 Free PMC article.
-
Copy number variants and genetic traits: closer to the resolution of phenotypic to genotypic variability.Nat Rev Genet. 2007 Aug;8(8):639-46. doi: 10.1038/nrg2149. Nat Rev Genet. 2007. PMID: 17637735 Review.
-
Copy-number variation and association studies of human disease.Nat Genet. 2007 Jul;39(7 Suppl):S37-42. doi: 10.1038/ng2080. Nat Genet. 2007. PMID: 17597780 Review.
Cited by
-
Human spermatogenic failure purges deleterious mutation load from the autosomes and both sex chromosomes, including the gene DMRT1.PLoS Genet. 2013 Mar;9(3):e1003349. doi: 10.1371/journal.pgen.1003349. Epub 2013 Mar 21. PLoS Genet. 2013. PMID: 23555275 Free PMC article.
-
Burden analysis of rare microdeletions suggests a strong impact of neurodevelopmental genes in genetic generalised epilepsies.PLoS Genet. 2015 May 7;11(5):e1005226. doi: 10.1371/journal.pgen.1005226. eCollection 2015 May. PLoS Genet. 2015. PMID: 25950944 Free PMC article.
-
Towards identification of individual etiologies by resolving genomic and biological conundrums in patients with autism spectrum disorders.Mol Syndromol. 2013 Jun;4(5):213-26. doi: 10.1159/000350041. Epub 2013 Apr 4. Mol Syndromol. 2013. PMID: 23885228 Free PMC article.
-
Cell-free DNA screening for rare autosomal trisomies and segmental chromosome imbalances.Prenat Diagn. 2022 Oct;42(11):1349-1357. doi: 10.1002/pd.6233. Epub 2022 Sep 22. Prenat Diagn. 2022. PMID: 36068932 Free PMC article.
-
Global diversity, population stratification, and selection of human copy-number variation.Science. 2015 Sep 11;349(6253):aab3761. doi: 10.1126/science.aab3761. Epub 2015 Aug 6. Science. 2015. PMID: 26249230 Free PMC article.
References
-
- Iafrate A.J., Feuk L., Rivera M.N., Listewnik M.L., Donahoe P.K., Qi Y., Scherer S.W., Lee C. Detection of large-scale variation in the human genome. Nat. Genet. 2004;36:949–951. - PubMed
-
- Sebat J., Lakshmi B., Troge J., Alexander J., Young J., Lundin P., Maner S., Massa H., Walker M., Chi M. Large-scale copy number polymorphism in the human genome. Science. 2004;305:525–528. - PubMed
-
- Tuzun E., Sharp A.J., Bailey J.A., Kaul R., Morrison V.A., Pertz L.M., Haugen E., Hayden H., Albertson D., Pinkel D. Fine-scale structural variation of the human genome. Nat. Genet. 2005;37:727–732. - PubMed
Publication types
MeSH terms
Grants and funding
LinkOut - more resources
Full Text Sources
Other Literature Sources
Medical
Molecular Biology Databases
Research Materials
Miscellaneous
