Gabrb3 gene deficient mice exhibit impaired social and exploratory behaviors, deficits in non-selective attention and hypoplasia of cerebellar vermal lobules: a potential model of autism spectrum disorder
- PMID: 17983671
- PMCID: PMC2684890
- DOI: 10.1016/j.bbr.2007.09.009
Gabrb3 gene deficient mice exhibit impaired social and exploratory behaviors, deficits in non-selective attention and hypoplasia of cerebellar vermal lobules: a potential model of autism spectrum disorder
Abstract
Objective: GABA(A) receptors play an important regulatory role in the developmental events leading to the formation of complex neuronal networks and to the behaviors they govern. The primary aim of this study was to assess whether gabrb3 gene deficient (gabrb3(-/-)) mice exhibit abnormal social behavior, a core deficit associated with autism spectrum disorder.
Methods: Social and exploratory behaviors along with non-selective attention were assessed in gabrb3(-/-), littermates (gabrb3(+/+)) and progenitor strains, C57BL/6J and 129/SvJ. In addition, semi-quantitative assessments of the size of cerebellar vermal lobules were performed on gabrb3(+/+) and gabrb3(-/-) mice.
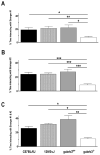
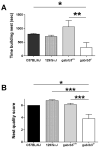
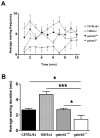
Results: Relative to controls, gabrb3(-/-) mice exhibited significant deficits in activities related to social behavior including sociability, social novelty and nesting. In addition, gabrb3(-/-) mice also exhibited differences in exploratory behavior compared to controls, as well as reductions in the frequency and duration of rearing episodes, suggested as being an index of non-selective attention. Gabrb3(-/-) mice also displayed significant hypoplasia of the cerebellar vermis compared to gabrb3(+/+) mice.
Conclusions: The observed behavioral deficits, especially regarding social behaviors, strengthens the face validity of the gabrb3 gene deficient mouse as being a model of autism spectrum disorder.
Figures


Similar articles
-
Gabrb3 gene deficient mice exhibit increased risk assessment behavior, hypotonia and expansion of the plexus of locus coeruleus dendrites.Brain Res. 2007 Jan 19;1129(1):191-9. doi: 10.1016/j.brainres.2006.10.050. Epub 2006 Dec 6. Brain Res. 2007. PMID: 17156762 Free PMC article.
-
Effects of oxytocin on serotonin 1B agonist-induced autism-like behavior in mice.Behav Brain Res. 2016 Nov 1;314:52-64. doi: 10.1016/j.bbr.2016.07.027. Epub 2016 Jul 18. Behav Brain Res. 2016. PMID: 27439030
-
Somatosensory and sensorimotor consequences associated with the heterozygous disruption of the autism candidate gene, Gabrb3.Behav Brain Res. 2011 Jan 1;216(1):36-45. doi: 10.1016/j.bbr.2010.06.032. Epub 2010 Aug 10. Behav Brain Res. 2011. PMID: 20699105 Free PMC article.
-
GABA and epileptogenesis: comparing gabrb3 gene-deficient mice with Angelman syndrome in man.Epilepsy Res. 1999 Sep;36(2-3):123-32. doi: 10.1016/s0920-1211(99)00046-7. Epilepsy Res. 1999. PMID: 10515160 Review.
-
GABRB3 gene deficient mice: a potential model of autism spectrum disorder.Int Rev Neurobiol. 2005;71:359-82. doi: 10.1016/s0074-7742(05)71015-1. Int Rev Neurobiol. 2005. PMID: 16512358 Review. No abstract available.
Cited by
-
Cerebellar Structure and Function in Autism Spectrum Disorder.J Psychiatr Brain Sci. 2022;7:e220003. doi: 10.20900/jpbs.20220003. Epub 2022 Jun 27. J Psychiatr Brain Sci. 2022. PMID: 35978711 Free PMC article.
-
Sex differences in neuronal systems function and behaviour: beyond a single diagnosis in autism spectrum disorders.Transl Psychiatry. 2021 Dec 9;11(1):625. doi: 10.1038/s41398-021-01757-1. Transl Psychiatry. 2021. PMID: 34887388 Free PMC article. Review.
-
Neuronal mechanisms and circuits underlying repetitive behaviors in mouse models of autism spectrum disorder.Behav Brain Funct. 2016 Jan 20;12(1):3. doi: 10.1186/s12993-016-0087-y. Behav Brain Funct. 2016. PMID: 26790724 Free PMC article. Review.
-
Deficits in cerebellum-dependent learning and cerebellar morphology in male and female BTBR autism model mice.NeuroSci. 2022 Dec;3(4):624-644. doi: 10.3390/neurosci3040045. Epub 2022 Nov 9. NeuroSci. 2022. PMID: 37366488 Free PMC article.
-
Conserved autism-associated genes tune social feeding behavior in C. elegans.Nat Commun. 2024 Oct 28;15(1):9301. doi: 10.1038/s41467-024-53590-x. Nat Commun. 2024. PMID: 39468047 Free PMC article.
References
-
- Allen G, Buxton RB, Wong EC, Courchesne E. Attentional activation of the cerebellum independent of motor involvement. Science. 1997;275:1940–3. - PubMed
-
- Allen G, Courchesne E. Attention function and dysfunction in autism. Front Biosci. 2001;6:D105–19. - PubMed
-
- Allen G, Muller RA, Courchesne E. Cerebellar function in autism: functional magnetic resonance image activation during a simple motor task. Biol Psychiatry. 2004;56:269–78. - PubMed
-
- Aspide R, Fresiello A, de Filippis G, Carnevale UA, Sadile AG. Non-selective attention in a rat model of hyperactivity and attention deficit: subchronic methylphenydate and nitric oxide synthesis inhibitor treatment. Neurosci Biobehav Rev. 2000;24:59–71. - PubMed
Publication types
MeSH terms
Substances
Grants and funding
LinkOut - more resources
Full Text Sources
Molecular Biology Databases

