Epimerase-deficiency galactosemia is not a binary condition
- PMID: 16385452
- PMCID: PMC1380226
- DOI: 10.1086/498985
Epimerase-deficiency galactosemia is not a binary condition
Abstract
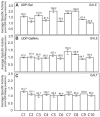
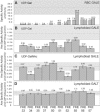
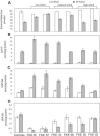
Epimerase-deficiency galactosemia results from the impairment of UDP-galactose 4'-epimerase (GALE), the third enzyme in the Leloir pathway of galactose metabolism. Originally identified as a clinically benign "peripheral" condition with enzyme impairment restricted to circulating blood cells, GALE deficiency was later demonstrated also to exist in a rare but clinically severe "generalized" form, with enzyme impairment affecting a range of tissues. Isolated cases of clinically and/or biochemically intermediate cases of epimerase deficiency have also been reported. We report here studies of 10 patients who, in the neonatal period, received the diagnosis of hemolysate epimerase deficiency. We have characterized these patients with regard to three parameters: (1) GALE activity in transformed lymphoblasts, representing a "nonperipheral" tissue, (2) metabolic sensitivity of those lymphoblasts to galactose challenge in culture, and (3) evidence of normal versus abnormal galactose metabolism in the patients themselves. Our results demonstrate two important points. First, whereas some of the patients studied exhibited near-normal levels of GALE activity in lymphoblasts, consistent with a diagnosis of peripheral epimerase deficiency, many did not. We detected a spectrum of GALE activity levels ranging from 15%-64% of control levels, demonstrating that epimerase deficiency is not a binary condition; it is a continuum disorder. Second, lymphoblasts demonstrating the most severe reduction in GALE activity also demonstrated abnormal metabolite levels in the presence of external galactose and, in some cases, also in the absence of galactose. These abnormalities included elevated galactose-1P, elevated UDP-galactose, and deficient UDP-glucose. Moreover, some of the patients themselves also demonstrated metabolic abnormalities, both on and off galactose-restricted diet. Long-term follow-up studies of these and other patients will be required to elucidate the clinical significance of these biochemical abnormalities and the potential impact of dietary intervention on outcome.
Figures


Similar articles
-
Hereditary galactosemia.Metabolism. 2018 Jun;83:188-196. doi: 10.1016/j.metabol.2018.01.025. Epub 2018 Jan 31. Metabolism. 2018. PMID: 29409891 Review.
-
Mediators of galactose sensitivity in UDP-galactose 4'-epimerase-impaired mammalian cells.J Biol Chem. 2005 Apr 8;280(14):13493-502. doi: 10.1074/jbc.M414045200. Epub 2005 Feb 8. J Biol Chem. 2005. PMID: 15701638
-
Human UDP-galactose 4' epimerase (GALE) gene and identification of five missense mutations in patients with epimerase-deficiency galactosemia.Mol Genet Metab. 1998 Jan;63(1):26-30. doi: 10.1006/mgme.1997.2645. Mol Genet Metab. 1998. PMID: 9538513
-
Characterization of two mutations associated with epimerase-deficiency galactosemia, by use of a yeast expression system for human UDP-galactose-4-epimerase.Am J Hum Genet. 1997 Sep;61(3):590-8. doi: 10.1086/515517. Am J Hum Genet. 1997. PMID: 9326324 Free PMC article.
-
The molecular basis of galactosemia - Past, present and future.Gene. 2016 Sep 10;589(2):133-41. doi: 10.1016/j.gene.2015.06.077. Epub 2015 Jul 2. Gene. 2016. PMID: 26143117 Review.
Cited by
-
Galactose toxicity in animals.IUBMB Life. 2009 Nov;61(11):1063-74. doi: 10.1002/iub.262. IUBMB Life. 2009. PMID: 19859980 Free PMC article. Review.
-
The Discovery of GALM Deficiency (Type IV Galactosemia) and Newborn Screening System for Galactosemia in Japan.Int J Neonatal Screen. 2021 Oct 25;7(4):68. doi: 10.3390/ijns7040068. Int J Neonatal Screen. 2021. PMID: 34842598 Free PMC article. Review.
-
Comparison of dynamics of wildtype and V94M human UDP-galactose 4-epimerase-A computational perspective on severe epimerase-deficiency galactosemia.Gene. 2013 Sep 10;526(2):318-24. doi: 10.1016/j.gene.2013.05.027. Epub 2013 May 31. Gene. 2013. PMID: 23732289 Free PMC article.
-
A Case Study of Monozygotic Twins Apparently Homozygous for a Novel Variant of UDP-Galactose 4'-epimerase (GALE) : A Complex Case of Variant GALE.JIMD Rep. 2013;7:89-98. doi: 10.1007/8904_2012_153. Epub 2012 Jul 1. JIMD Rep. 2013. PMID: 23430501 Free PMC article.
-
Manganese-based superoxide dismutase mimics modify both acute and long-term outcome severity in a Drosophila melanogaster model of classic galactosemia.Antioxid Redox Signal. 2014 May 20;20(15):2361-71. doi: 10.1089/ars.2012.5122. Epub 2013 Jul 20. Antioxid Redox Signal. 2014. PMID: 23758052 Free PMC article.
References
Web Resources
-
- ExPASy, http://us.expasy.org/ (for GALK [EC 2.7.1.6], GALT [EC 2.7.7.12], and GALE [EC 5.1.3.2])
-
- GenBank, http://www.ncbi.nlm.nih.gov/Genbank/ (for hGALE reference sequences [accession numbers AF022382, NM_000403, NM_001008216, BC001273, CR616589, CR611350, CR602422, CR596991, CR592671, BC050685, L41668, CR592211, CR616462, CR601378, AL031295, DQ233667, and DQ233668])
-
- Online Mendelian Inheritance in Man (OMIM), http://www.ncbi.nlm.nih.gov/entrez/Omim/
References
-
- Alano A, Almashanu S, Maceratesi P, Reichardt J, Panny S, Cowan TM (1997) UDP-galactose-4-epimerase deficiency among African-Americans: evidence for multiple alleles. J Investig Med 45:191A
-
- Davis L, Kuehl M, Battey J (1994) Basic methods in molecular biology. 2nd ed. Appleton and Lange, Norwalk, CT
Publication types
MeSH terms
Substances
LinkOut - more resources
Full Text Sources
Medical
Molecular Biology Databases

