. 2004 May;2(5):E126.
doi: 10.1371/journal.pbio.0020126. Epub 2004 Mar 23.

Accelerated evolution of the ASPM gene controlling brain size begins prior to human brain expansion

Affiliations

Accelerated evolution of the ASPM gene controlling brain size begins prior to human brain expansion

Natalay Kouprina et al. PLoS Biol. 2004 May.

Abstract

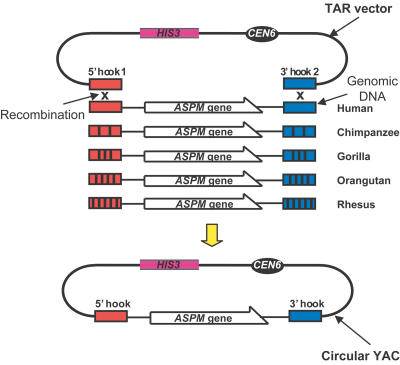
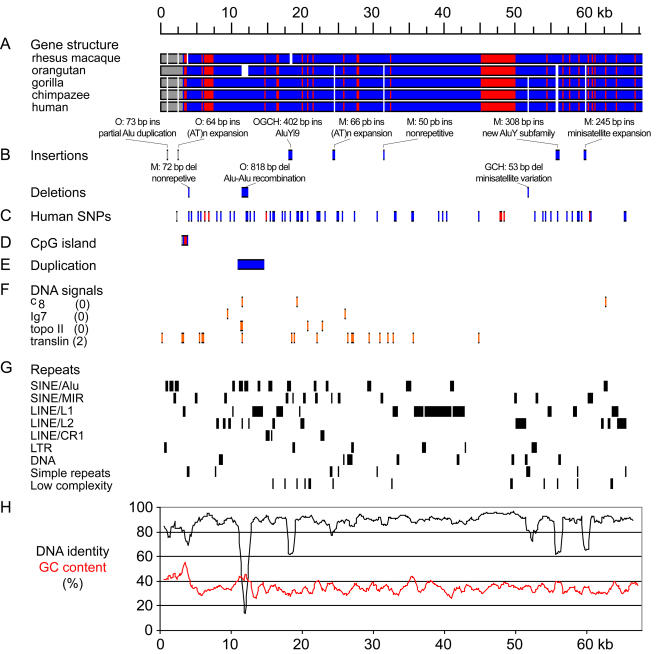
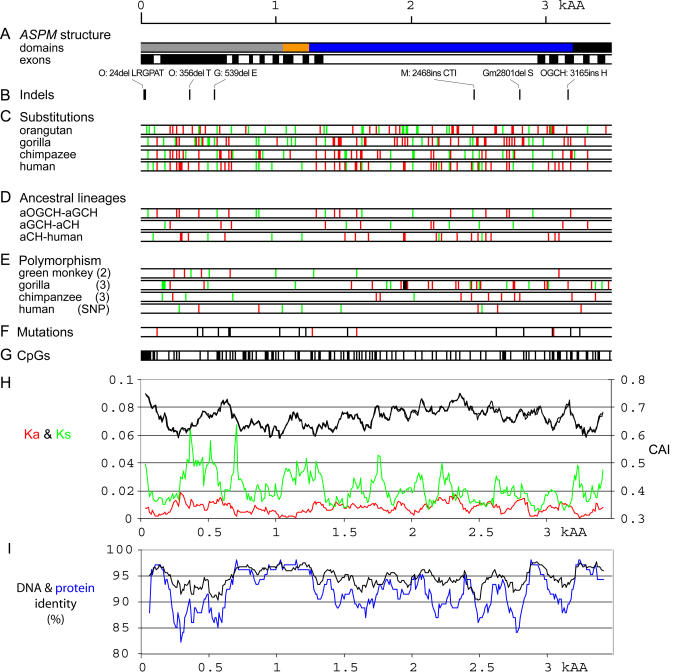
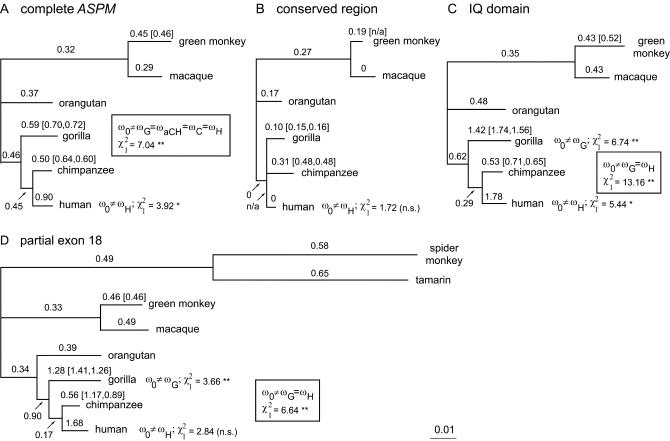
Primary microcephaly (MCPH) is a neurodevelopmental disorder characterized by global reduction in cerebral cortical volume. The microcephalic brain has a volume comparable to that of early hominids, raising the possibility that some MCPH genes may have been evolutionary targets in the expansion of the cerebral cortex in mammals and especially primates. Mutations in ASPM, which encodes the human homologue of a fly protein essential for spindle function, are the most common known cause of MCPH. Here we have isolated large genomic clones containing the complete ASPM gene, including promoter regions and introns, from chimpanzee, gorilla, orangutan, and rhesus macaque by transformation-associated recombination cloning in yeast. We have sequenced these clones and show that whereas much of the sequence of ASPM is substantially conserved among primates, specific segments are subject to high Ka/Ks ratios (nonsynonymous/synonymous DNA changes) consistent with strong positive selection for evolutionary change. The ASPM gene sequence shows accelerated evolution in the African hominoid clade, and this precedes hominid brain expansion by several million years. Gorilla and human lineages show particularly accelerated evolution in the IQ domain of ASPM. Moreover, ASPM regions under positive selection in primates are also the most highly diverged regions between primates and nonprimate mammals. We report the first direct application of TAR cloning technology to the study of human evolution. Our data suggest that evolutionary selection of specific segments of the ASPM sequence strongly relates to differences in cerebral cortical size.


Conflict of interest statement

The authors have declared that no conflicts of interest exist.

Figures

Figure 1
Figure 1. Isolation of the Syntenic Genomic Regions Containing the ASPM Gene from Human, Chimpanzee, Gorilla, Orangutan, and Rhesus Macaque by TAR Cloning
The method exploits a high level of recombination between homologous DNA sequences during transformation in the yeast Saccharomyces cerevisiae. For isolation, genomic DNA is transformed into yeast spheroplasts along with a TAR vector that contains targeting hooks homologous to the genomic DNA sequence. CEN corresponds to the yeast Chromosome VI centromere; HIS3 is a yeast selectable marker. Recombination between the vector and the genomic DNA fragment results in cloning of the gene/region of interest as YAC. Chromosomal regions with sizes up to 250 kb can be isolated by TAR cloning. For cloning purposes, TAR vector was designed containing a 5′ hook specific to exon 1 and a 3′ hook specific to the 3′ end of the human ASPM. Transformation experiments were carried out with freshly prepared spheroplasts for each species. To identify ASPM-containing clones, the transformants were combined into pools and examined by PCR for the presence of the unique ASPM sequences not present in the vector. The yield of ASPM-positive clones from primate species was the same as that from the human DNA (3%). Because the TAR procedure produces multiple gene isolates, six independent TAR isolates for each species were checked. The detectable size of the cloned material corresponded to that predicted if the entire ASPM gene had been cloned, i.e., all gene-positive clones contained circular YACs with approximately 65-kb DNA inserts. Alu profiles for each species were determined and found to be identical for each species, suggesting that the isolated YACs contained nonrearranged genomic segments. Finally the YACs were retrofitted into BACs, and their restriction patterns were examined by three restriction endonuclease digestions. No differences between ASPM clones for each species were found.
Figure 2
Figure 2. Structure and Evolution of the ASPM Gene in Primates
The scale of all plots corresponds to the consensus sequence obtained based on a multiple alignment of five ASPM genes. (A) Schematic representation of the alignment. Promoter regions, exons, and introns are marked in gray, red, and blue, respectively. White segments correspond to gaps. (B) Positions of long (50 bp or longer) insertions/deletions. “O” denotes orangutan, “M” macaque, “OGCH” the orangutan–gorilla–chimpanzee–human clade, and “GCH” the gorilla–chimpanzee–human clade. (C) Positions of polymorphic bases derived from the GenBank single nucleotide polymorphism (SNP) database. (D) Positions of the CpG island. The approximately 800-bp-long CpG island includes promoter, 5′ UTR, first exon, and a small portion of the first intron. (E) Location of an approximately 3-kb-long segmental duplication. (F) Positions of selected motifs associated with genomic rearrangements in the human sequence. Numbers in parentheses reflect number of allowed differences from the consensus motif (zero for short or two ambiguous motifs, two for longer sites). (G) Distribution of repetitive elements. The individual ASPM genes share the same repeats except of indels marked in (B). (H) DNA identity and GC content. Both plots were made using a 1-kb-long sliding window with 100-bp overlaps. The GC profile corresponds to the consensus sequence; the individual sequences have nearly identical profiles.
Figure 3
Figure 3. Structure of ASPM CDSs and Evolution in Primates
The scale of all plots corresponds to the 3,480-amino-acid-long protein alignment; positions in the CDS were scaled accordingly. (A) Structure of the human ASPM CDS and protein. The first scheme shows positions of major domains in the ASPM protein (Bond et al. 2002). The putative microtubule-binding domain is in gray, the calponin-homology domain in orange, IQ repeats in blue, and the terminal domain in black. Positions of exons in the CDS are drawn in the second block. To separate individual exons, odd numbered exons are colored in black and even numbered ones in white. (B) Positions of insertions/deletions in the protein sequences. Coordinates correspond to the human protein sequence. “O” denotes orangutan, “G” gorilla, “M” macaque, “Gm” African green monkey, and “OGCH” the orangutan–gorilla–chimpanzee–human clade. (C) Substitutions in hominoid CDSs relative to the common ancestor. The expected ancestor CDS was derived using ML codon reconstruction implemented in PAML. African green monkey and rhesus macaque were outgroups. Nonsynonymous/synonymous (ω = Ka/Ks) ratios were free to vary in all branches. Positions marked in green correspond to synonymous changes relative to the ancestral sequence; the red bars indicate nonsynonymous changes. (D) Synonymous (red) and nonsynonymous (green) changes in ancestral lineages leading to human. aOGCH–aGCH is the ancestral lineage from the orangutan divergence to the gorilla divergence; aGCH–aCH represents the lineage from the gorilla divergence to the chimpanzee common ancestor. aCH–human corresponds to the human lineage after the chimpanzee divergence. There are seven synonymous and 19 nonsynonymous human-specific substitutions. Methods and description are the same as in (C). (E) Positions of polymorphic bases for different CDSs of African green monkey, gorilla, chimpanzee, and human. Positions marked in green correspond to synonymous polymorphisms, and the red bars indicate nonsynonymous sites. Numbers of compared sequences are in parentheses; in the case of human we show nine polymorphic positions (four synonymous and five nonsynomous) from the GenBank SNP database. ASPM mutations detected in MCPH patients are shown separately in (F). (F) Positions of 19 mutations reported for MCPH patients (Bond et al. 2002; Bond et al. 2003). All the reported mutations introduce premature stop codons. Mutation sites located within CpG dinucleotides are highlighted in red. (G) Positions of CpG dinucleotides in the human CDS. (H) Comparison of Ka and Ks rates with codon adaptation index (CAI). Ka and Ks values are for all branches (fixed ω ratio); CAI is an average for all five primates (note that CAI differences are very small between the five species). The window was set to 300 bp (100 amino acids) with a 30-bp (10-amino-acid) step. (I) Conservation at the nucleotide and protein level in primates. Y-axis corresponds to proportions of conserved (identical) positions in the CDS and the protein alignment. The plot was obtained using 100-amino-acid-long, overlapping windows, and the step was set to 10 amino acids. In the case of CDS conservation, the window was 300 bp and step 30 bp.
Figure 4
Figure 4. Phylogenetic Trees and ω ratio for Complete ASPM and Three Selected Segments
Trees and ω (Ka/Ka) ratios were computed using the ML method for codons implemented in PAML. Branch lengths represent ML distances for codons, i.e., using both synonymous and nonsynonymous nucleotide sites, and in all branches the ω ratio was set free to vary. All trees are drawn to the same scale. Branch labels mark the ω ratios for corresponding branches. Values in square brackets show ω for additional cDNA sequences whenever available. Default values and branch lengths were calculated from genomic copies. Selected tested hypotheses are listed. ωH stands for the ω rate in the human lineage, ωC in the chimpanzee lineage, ωCH in the common human–chimpanzee ancestral lineage after the gorilla divergence, ωG in the gorilla lineage, and ω0 in all other branches. Single asterisks indicate p < 0.05, χ2 1 = 3.84; double asterisks indicate p < 0.01, χ2 1 = 6.63. (A) Phylogeny for the complete ASPM CDS. In addition to testing different ω values in the human lineage, we also tested the hypothesis that the complete gorilla–chimpanzee–human clade evolved at a constant rate, different from the rest of the tree (compared to the one-ratio model, boxed). (B) The ASPM phylogeny derived from a conserved segment from exon 5 to the beginning of the IQ domain (amino acids 676–1,266). The branch connecting the human and chimpanzee common ancestor with the gorilla–chimpanzee–human common ancestor had no substitutions, therefore the ω ratio could not be calculated. (C) IQ domain (amino acids 1,267–3,225). We also tested the hypothesis that the gorilla and human lineages evolved at the same ω rate, different from the rest of the tree (compared to the one-ratio model, boxed). (D) Phylogeny of eight primate sequences from a 1,215-amino-acid-long segment of exon 18 (amino acids 1,640–2,855). We also tested the hypothesis that the gorilla and human lineages evolved at the same ω rate, different from the rest of the tree (compared to the one-ratio model, boxed).

Similar articles

Cited by

References

    1. Abeysinghe SS, Chuzhanova N, Krawczak M, Ball EV, Cooper DN. Translocation and gross deletion breakpoints in human inherited disease and cancer. I: Nucleotide composition and recombination-associated motifs. Hum Mutat. 2003;22:229–244. - PubMed
    1. Aota S, Ikemura T. Diversity in G + C content at the third position of codons in vertebrate genes and its cause. Nucleic Acids Res. 1986;14:6345–6355. - PMC - PubMed
    1. Benson G. Tandem repeats finder: A program to analyze DNA sequences. Nucleic Acids Res. 1999;27:573–580. - PMC - PubMed
    1. Bernardi G, Bernardi G. Codon usage and genome composition. J Mol Evol. 1985;22:363–365. - PubMed
    1. Bond J, Roberts E, Mochida GH, Hampshire DJ, Scott S, et al. ASPM is a major determinant of cerebral cortical size. Nat Genet. 2002;32:316–320. - PubMed

MeSH terms