

The classical pathway is the dominant complement pathway required for innate immunity to Streptococcus pneumoniae infection in mice
- PMID: 12477926
- PMCID: PMC139253
- DOI: 10.1073/pnas.012669199
The classical pathway is the dominant complement pathway required for innate immunity to Streptococcus pneumoniae infection in mice
Abstract
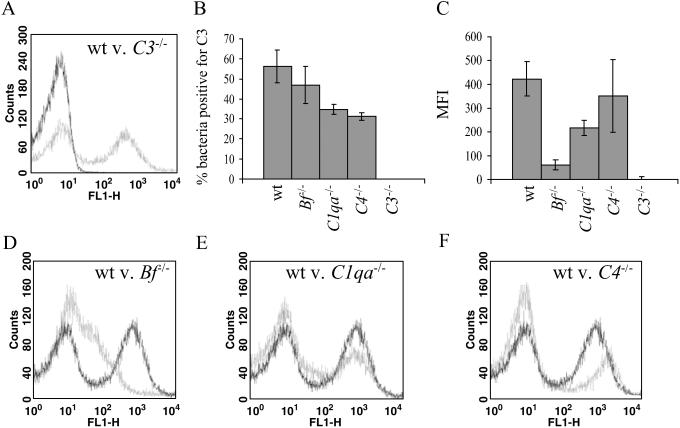
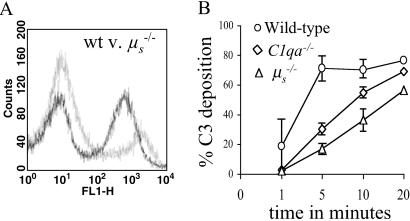
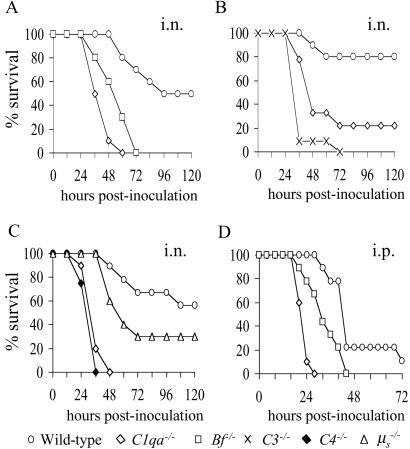
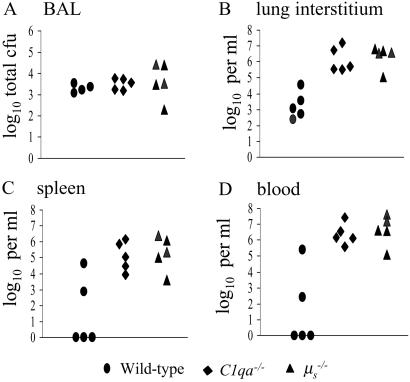
The complement system is an important component of the innate immune response to bacterial pathogens, including Streptococcus pneumoniae. The classical complement pathway is activated by antibody-antigen complexes on the bacterial surface and has been considered predominately to be an effector of the adaptive immune response, whereas the alternative and mannose-binding lectin pathways are activated directly by bacterial cell surface components and are considered effectors of the innate immune response. Recently, a role has been suggested for the classical pathway during innate immunity that is activated by natural IgM or components of the acute-phase response bound to bacterial pathogens. However, the functional importance of the classical pathway for innate immunity to S. pneumoniae and other bacterial pathogens, and its relative contribution compared with the alternative and mannose-binding lectin pathways has not been defined. By using strains of mice with genetic deficiencies of complement components and secretory IgM we have investigated the role of each complement pathway and natural IgM for innate immunity to S. pneumoniae. Our results show that the proportion of a population of S. pneumoniae bound by C3 depends mainly on the classical pathway, whereas the intensity of C3 binding depends on the alternative pathway. Furthermore, the classical pathway, partially targeted by the binding of natural IgM to bacteria, is the dominant pathway for activation of the complement system during innate immunity to S. pneumoniae, loss of which results in rapidly progressing septicemia and impaired macrophage activation. These data demonstrate the vital role of the classical pathway for innate immunity to a bacterial pathogen.
Figures
Similar articles
-
Additive inhibition of complement deposition by pneumolysin and PspA facilitates Streptococcus pneumoniae septicemia.J Immunol. 2005 Aug 1;175(3):1813-9. doi: 10.4049/jimmunol.175.3.1813. J Immunol. 2005. PMID: 16034123
-
Pleiotropic effects of cell wall amidase LytA on Streptococcus pneumoniae sensitivity to the host immune response.Infect Immun. 2015 Feb;83(2):591-603. doi: 10.1128/IAI.02811-14. Epub 2014 Nov 17. Infect Immun. 2015. PMID: 25404032 Free PMC article.
-
A dominant complement fixation pathway for pneumococcal polysaccharides initiated by SIGN-R1 interacting with C1q.Cell. 2006 Apr 7;125(1):47-58. doi: 10.1016/j.cell.2006.01.046. Cell. 2006. PMID: 16615889
-
Complement and the host's defense against the pneumococcus.Crit Rev Microbiol. 1984;11(3):187-208. doi: 10.3109/10408418409105903. Crit Rev Microbiol. 1984. PMID: 6391822 Review.
-
Interaction of C1q and mannan-binding lectin with viruses.Immunobiology. 2002 Sep;205(4-5):563-74. doi: 10.1078/0171-2985-00155. Immunobiology. 2002. PMID: 12396016 Review.
Cited by
-
Protective role of host complement system in Aspergillus fumigatus infection.Front Immunol. 2022 Sep 23;13:978152. doi: 10.3389/fimmu.2022.978152. eCollection 2022. Front Immunol. 2022. PMID: 36211424 Free PMC article.
-
Mechanistic exploration of AhR-mediated host protection against Streptococcus pneumoniae infection.Int Immunopharmacol. 2012 Aug;13(4):490-8. doi: 10.1016/j.intimp.2012.05.008. Epub 2012 May 23. Int Immunopharmacol. 2012. PMID: 22634480 Free PMC article.
-
Antibodies to the iron uptake ABC transporter lipoproteins PiaA and PiuA promote opsonophagocytosis of Streptococcus pneumoniae.Infect Immun. 2005 Oct;73(10):6852-9. doi: 10.1128/IAI.73.10.6852-6859.2005. Infect Immun. 2005. PMID: 16177364 Free PMC article.
-
C3b/iC3b deposition on Streptococcus pneumoniae is not affected by HIV infection.PLoS One. 2010 Jan 26;5(1):e8902. doi: 10.1371/journal.pone.0008902. PLoS One. 2010. PMID: 20126656 Free PMC article.
-
Effects of Expression of Streptococcus pneumoniae PspC on the Ability of Streptococcus mitis to Evade Complement-Mediated Immunity.Front Microbiol. 2021 Nov 22;12:773877. doi: 10.3389/fmicb.2021.773877. eCollection 2021. Front Microbiol. 2021. PMID: 34880844 Free PMC article.
References
Publication types
MeSH terms
Substances
LinkOut - more resources
Full Text Sources
Other Literature Sources
Medical
Miscellaneous
